
|
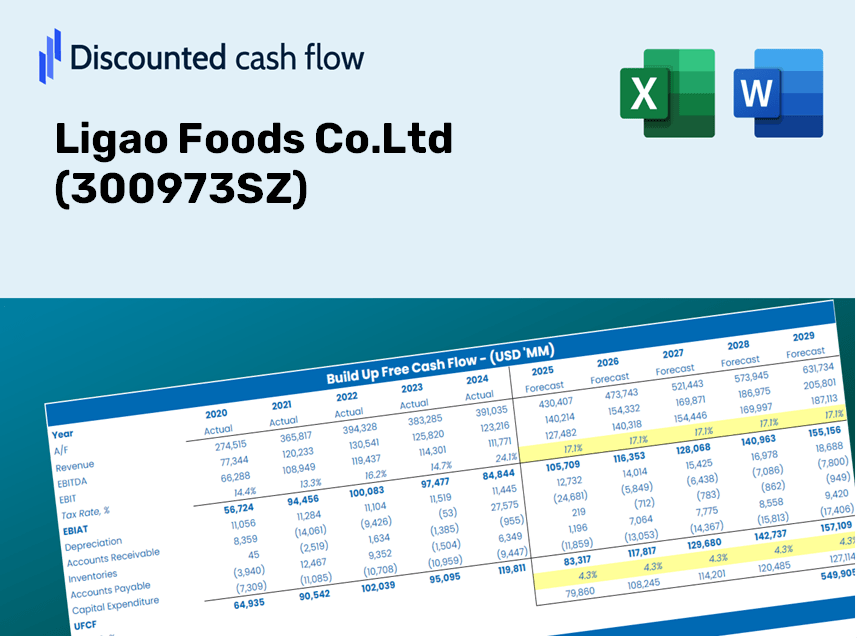
Ligao Foods Co.Ltd (300973.SZ) Valation DCF |
Entièrement Modifiable: Adapté À Vos Besoins Dans Excel Ou Sheets
Conception Professionnelle: Modèles Fiables Et Conformes Aux Normes Du Secteur
Pré-Construits Pour Une Utilisation Rapide Et Efficace
Compatible MAC/PC, entièrement débloqué
Aucune Expertise N'Est Requise; Facile À Suivre
Ligao Foods Co.Ltd (300973.SZ) Bundle
Évaluez les perspectives financières de Ligao Foods Co. Ltd comme un expert! Cette calculatrice DCF (300973SZ) fournit des données financières pré-remplies et vous permet de modifier facilement la croissance des revenus, le WACC, les marges et d'autres hypothèses essentielles pour vous aligner sur vos projections.
What You Will Receive
- Authentic Ligao Foods Financial Data: Pre-populated with historical and forecasted figures for in-depth analysis.
- Completely Customizable Template: Easily adjust key parameters such as revenue growth, WACC, and EBITDA margin.
- Real-Time Calculations: Instantly view updates to Ligao Foods’ intrinsic value based on your modifications.
- Expert Valuation Tool: Tailored for investors, analysts, and consultants aiming for precise DCF outcomes.
- User-Friendly Interface: Intuitive layout and straightforward guidance suitable for all skill levels.
Key Features
- Customizable Forecast Inputs: Adjust essential metrics such as revenue growth, EBITDA percentage, and capital investments.
- Instant DCF Valuation: Quickly computes intrinsic value, NPV, and additional financial metrics.
- High-Precision Accuracy: Leverages Ligao Foods Co. Ltd’s real-world financial data for dependable valuation results.
- Simplified Scenario Analysis: Effortlessly evaluate various assumptions and analyze different outcomes.
- Efficiency Boost: Avoid the hassle of constructing intricate valuation models from the ground up.
How It Works
- Step 1: Download the Excel file for Ligao Foods Co. Ltd (300973SZ).
- Step 2: Review the pre-filled financial data and projections provided for Ligao Foods.
- Step 3: Adjust key variables such as revenue growth, WACC, and tax rates (highlighted cells).
- Step 4: Observe the DCF model refresh in real-time as you modify your inputs.
- Step 5: Evaluate the outputs and leverage the findings for your investment strategies.
Why Choose Ligao Foods' Calculator?
- Time Efficient: Skip the hassle of building a DCF model from the ground up – it's pre-built and ready for use.
- Enhanced Accuracy: Dependable financial data and formulas minimize valuation errors.
- Completely Customizable: Adapt the model to align with your specific assumptions and forecasts.
- User-Friendly: Intuitive charts and outputs simplify the analysis of results.
- Endorsed by Professionals: Created for experts who prioritize precision and ease of use.
Who Should Consider Ligao Foods Co., Ltd. ([300973SZ])?
- Investment Professionals: Develop comprehensive and accurate valuation models for effective portfolio management.
- Corporate Finance Departments: Evaluate valuation scenarios to inform strategic decision-making within the organization.
- Consultants and Financial Advisors: Offer clients precise valuation insights related to Ligao Foods Co., Ltd. ([300973SZ]).
- Academic Students and Instructors: Utilize real-world data for practical learning and teaching in financial modeling.
- Food Industry Enthusiasts: Gain insight into how companies like Ligao Foods Co., Ltd. ([300973SZ]) are valued in the market.
Contents of the Template
- Pre-Filled DCF Model: Ligao Foods Co.Ltd's financial data preloaded for immediate analysis.
- WACC Calculator: Comprehensive calculations for the Weighted Average Cost of Capital.
- Financial Ratios: Assess Ligao Foods Co.Ltd's profitability, leverage, and operational efficiency.
- Editable Inputs: Modify assumptions on growth rates, margins, and capital expenditures to suit your scenarios.
- Financial Statements: Access annual and quarterly reports for in-depth analysis.
- Interactive Dashboard: Effortlessly visualize key valuation metrics and outcomes.
Disclaimer
All information, articles, and product details provided on this website are for general informational and educational purposes only. We do not claim any ownership over, nor do we intend to infringe upon, any trademarks, copyrights, logos, brand names, or other intellectual property mentioned or depicted on this site. Such intellectual property remains the property of its respective owners, and any references here are made solely for identification or informational purposes, without implying any affiliation, endorsement, or partnership.
We make no representations or warranties, express or implied, regarding the accuracy, completeness, or suitability of any content or products presented. Nothing on this website should be construed as legal, tax, investment, financial, medical, or other professional advice. In addition, no part of this site—including articles or product references—constitutes a solicitation, recommendation, endorsement, advertisement, or offer to buy or sell any securities, franchises, or other financial instruments, particularly in jurisdictions where such activity would be unlawful.
All content is of a general nature and may not address the specific circumstances of any individual or entity. It is not a substitute for professional advice or services. Any actions you take based on the information provided here are strictly at your own risk. You accept full responsibility for any decisions or outcomes arising from your use of this website and agree to release us from any liability in connection with your use of, or reliance upon, the content or products found herein.