
|
Hudi Industrial Group Company Limited (300979.SZ) Évaluation DCF |
Entièrement Modifiable: Adapté À Vos Besoins Dans Excel Ou Sheets
Conception Professionnelle: Modèles Fiables Et Conformes Aux Normes Du Secteur
Pré-Construits Pour Une Utilisation Rapide Et Efficace
Compatible MAC/PC, entièrement débloqué
Aucune Expertise N'Est Requise; Facile À Suivre
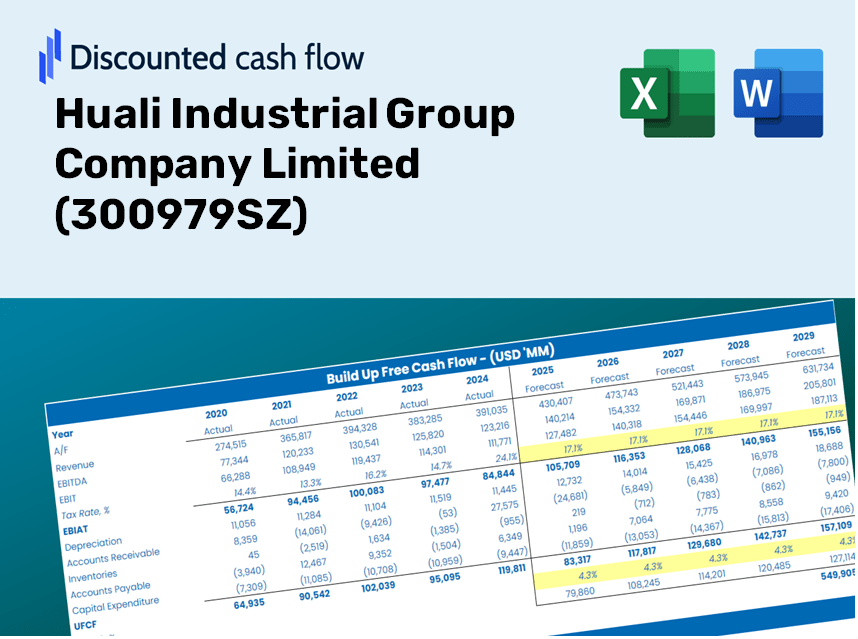
Huali Industrial Group Company Limited (300979.SZ) Bundle
Faites des choix d'investissement plus éclairés avec la calculatrice DCF Huali Industrial Group Company Limited (300979SZ)! Explorez des données financières authentiques, ajustez les projections et les dépenses de croissance et observez instantanément les effets de ces changements sur la valeur intrinsèque de la société Huali Industrial Group.
Benefits You Will Receive
- Authentic Huali Financials: Access historical and projected data for precise valuation.
- Customizable Inputs: Adjust WACC, tax rates, revenue growth, and capital expenditures as needed.
- Real-Time Calculations: Intrinsic value and NPV calculated on-the-fly.
- Scenario Evaluation: Explore various scenarios to assess the future performance of Huali.
- User-Friendly Interface: Designed for professionals but easy for newcomers to navigate.
Key Features
- Reliable Huali Financials: Gain access to precise pre-loaded historical data and future forecasts for Huali Industrial Group Company Limited (300979SZ).
- Adjustable Forecast Assumptions: Modify yellow-highlighted fields such as WACC, growth rates, and profit margins.
- Real-time Calculations: Enjoy automatic updates for DCF, Net Present Value (NPV), and cash flow analysis.
- Interactive Dashboard: Easily digestible charts and summaries to visualize your valuation insights.
- Designed for All Levels: An intuitive and straightforward layout tailored for investors, CFOs, and consultants alike.
How It Works
- Step 1: Download the prebuilt Excel template featuring Huali Industrial Group Company Limited's (300979SZ) data.
- Step 2: Navigate through the pre-filled sheets to familiarize yourself with the essential metrics.
- Step 3: Modify forecasts and assumptions in the editable yellow cells (WACC, growth, margins) as needed.
- Step 4: Instantly view the updated results, including Huali Industrial Group Company Limited's (300979SZ) intrinsic value.
- Step 5: Utilize the output to make informed investment decisions or create comprehensive reports.
Why Opt for Huali Industrial Group's Calculator?
- Time-Efficient: Skip the hassle of building a DCF model from the ground up – it's immediately available for use.
- Enhanced Reliability: Accurate financial data and formulas minimize valuation errors.
- Completely Adaptable: Customize the model to align with your specific assumptions and forecasts.
- User-Friendly: Intuitive charts and outputs make it easy to understand the results.
- Backed by Professionals: Created for industry experts who prioritize accuracy and ease of use.
Who Can Benefit from This Product?
- Investors: Assess Huali Industrial Group Company Limited's fair value before making investment choices.
- CFOs: Utilize a professional-grade DCF model for accurate financial reporting and analysis.
- Consultants: Efficiently customize the template for valuation reports tailored to your clients.
- Entrepreneurs: Discover insights into financial modeling techniques employed by industry leaders.
- Educators: Implement it as an educational resource to illustrate valuation methodologies.
Contents of the Template
- Preloaded Huali Industrial Data: Historical and projected financial metrics, including revenue, EBIT, and capital expenditures.
- DCF and WACC Models: High-quality spreadsheets for determining intrinsic value and Weighted Average Cost of Capital.
- Editable Inputs: Cells marked in yellow for customizing revenue growth, tax rates, and discount rates.
- Financial Statements: Detailed annual and quarterly financial reports for in-depth analysis.
- Key Ratios: Metrics for profitability, leverage, and efficiency to assess performance.
- Dashboard and Charts: Visual representations of valuation results and underlying assumptions.
Disclaimer
All information, articles, and product details provided on this website are for general informational and educational purposes only. We do not claim any ownership over, nor do we intend to infringe upon, any trademarks, copyrights, logos, brand names, or other intellectual property mentioned or depicted on this site. Such intellectual property remains the property of its respective owners, and any references here are made solely for identification or informational purposes, without implying any affiliation, endorsement, or partnership.
We make no representations or warranties, express or implied, regarding the accuracy, completeness, or suitability of any content or products presented. Nothing on this website should be construed as legal, tax, investment, financial, medical, or other professional advice. In addition, no part of this site—including articles or product references—constitutes a solicitation, recommendation, endorsement, advertisement, or offer to buy or sell any securities, franchises, or other financial instruments, particularly in jurisdictions where such activity would be unlawful.
All content is of a general nature and may not address the specific circumstances of any individual or entity. It is not a substitute for professional advice or services. Any actions you take based on the information provided here are strictly at your own risk. You accept full responsibility for any decisions or outcomes arising from your use of this website and agree to release us from any liability in connection with your use of, or reliance upon, the content or products found herein.