
|
BIC Camera Inc. (3048.T) Évaluation DCF |
Entièrement Modifiable: Adapté À Vos Besoins Dans Excel Ou Sheets
Conception Professionnelle: Modèles Fiables Et Conformes Aux Normes Du Secteur
Pré-Construits Pour Une Utilisation Rapide Et Efficace
Compatible MAC/PC, entièrement débloqué
Aucune Expertise N'Est Requise; Facile À Suivre
Bic Camera Inc. (3048.T) Bundle
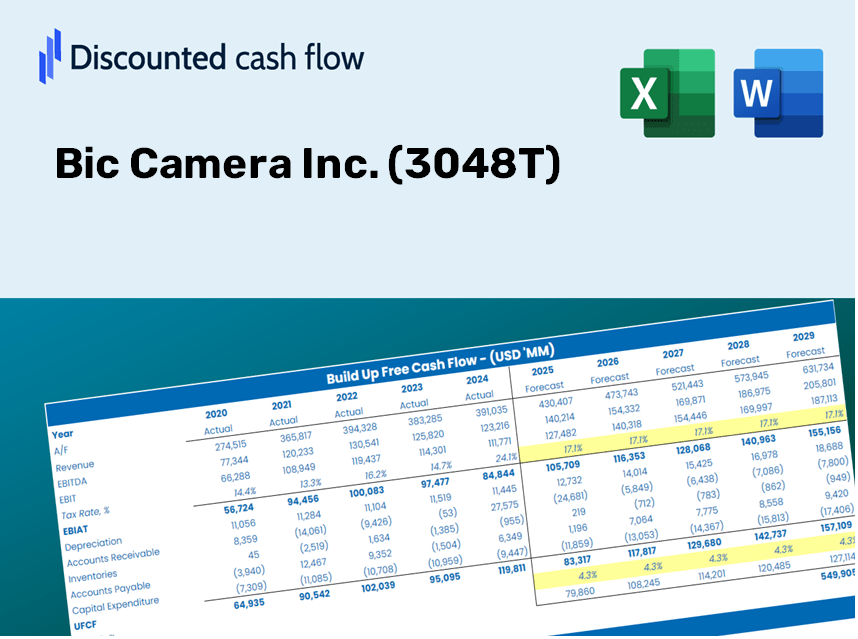
Explorez les perspectives financières de BIC Camera Inc. (3048T) à l'aide de notre calculatrice DCF conviviale! Entrez vos projections pour la croissance, les marges et les dépenses pour déterminer la valeur intrinsèque de BIC Camera Inc. (3048T) et affiner votre approche d'investissement.
What You Will Receive
- Authentic Bic Camera Data: Preloaded financial metrics – including revenues and EBIT – based on real and forecasted figures.
- Comprehensive Customization: Modify all key parameters (yellow cells) such as WACC, growth rate, and tax percentages.
- Immediate Valuation Adjustments: Automatic recalculations to assess the impact of changes on Bic Camera's fair value.
- Flexible Excel Template: Designed for quick modifications, scenario simulations, and thorough projections.
- Efficient and Precise: Eliminate the need to build models from the ground up while ensuring accuracy and adaptability.
Key Features
- Customizable Forecast Inputs: Adjust essential factors such as sales growth, operating margin, and investment expenditures.
- Instant DCF Valuation: Quickly computes intrinsic value, NPV, and additional financial metrics.
- High-Precision Results: Leverages Bic Camera Inc.'s (3048T) actual financial data for more accurate valuation projections.
- Effortless Scenario Analysis: Easily explore various assumptions and assess the resulting impacts.
- Efficiency Booster: Streamline your workflow by avoiding the creation of intricate valuation models from the ground up.
How It Works
- Step 1: Download the Excel file for Bic Camera Inc. (3048T).
- Step 2: Review Bic Camera’s pre-filled financial data and forecasts.
- Step 3: Adjust key inputs such as sales growth, WACC, and tax rates (highlighted cells).
- Step 4: Observe the DCF model refresh automatically as you modify the assumptions.
- Step 5: Evaluate the outputs and leverage the results for your investment strategies.
Why Opt for This Calculator?
- User-Friendly Interface: Perfect for both novices and seasoned users.
- Customizable Inputs: Adjust parameters easily to suit your analysis.
- Real-Time Updates: Monitor immediate changes to Bic Camera Inc.'s (3048T) valuation as you tweak the inputs.
- Preloaded Data: Comes with Bic Camera Inc.'s (3048T) actual financial figures for swift evaluations.
- Relied Upon by Experts: A go-to tool for investors and analysts for making well-informed decisions.
Who Should Use This Product?
- Investors: Effectively assess the fair value of Bic Camera Inc. (3048T) prior to making investment choices.
- CFOs: Utilize a high-quality DCF model for financial reporting and comprehensive analysis.
- Consultants: Easily customize the template for valuation reports tailored to clients.
- Entrepreneurs: Discover financial modeling insights employed by industry-leading companies.
- Educators: Incorporate it as a teaching resource to illustrate valuation techniques.
Contents of the Template
- Pre-Filled DCF Model: Bic Camera Inc.'s (3048T) financial data preloaded for immediate application.
- WACC Calculator: Comprehensive calculations for the Weighted Average Cost of Capital.
- Financial Ratios: Assess Bic Camera Inc.'s (3048T) profitability, leverage, and operational efficiency.
- Editable Inputs: Modify assumptions like growth rates, profit margins, and capital expenditures to suit your scenarios.
- Financial Statements: Access annual and quarterly reports for in-depth analysis.
- Interactive Dashboard: Visualize essential valuation metrics and outcomes effortlessly.
Disclaimer
All information, articles, and product details provided on this website are for general informational and educational purposes only. We do not claim any ownership over, nor do we intend to infringe upon, any trademarks, copyrights, logos, brand names, or other intellectual property mentioned or depicted on this site. Such intellectual property remains the property of its respective owners, and any references here are made solely for identification or informational purposes, without implying any affiliation, endorsement, or partnership.
We make no representations or warranties, express or implied, regarding the accuracy, completeness, or suitability of any content or products presented. Nothing on this website should be construed as legal, tax, investment, financial, medical, or other professional advice. In addition, no part of this site—including articles or product references—constitutes a solicitation, recommendation, endorsement, advertisement, or offer to buy or sell any securities, franchises, or other financial instruments, particularly in jurisdictions where such activity would be unlawful.
All content is of a general nature and may not address the specific circumstances of any individual or entity. It is not a substitute for professional advice or services. Any actions you take based on the information provided here are strictly at your own risk. You accept full responsibility for any decisions or outcomes arising from your use of this website and agree to release us from any liability in connection with your use of, or reliance upon, the content or products found herein.