
|
Daiwabo Holdings Co., Ltd. (3107.T) Évaluation DCF |
Entièrement Modifiable: Adapté À Vos Besoins Dans Excel Ou Sheets
Conception Professionnelle: Modèles Fiables Et Conformes Aux Normes Du Secteur
Pré-Construits Pour Une Utilisation Rapide Et Efficace
Compatible MAC/PC, entièrement débloqué
Aucune Expertise N'Est Requise; Facile À Suivre
Daiwabo Holdings Co., Ltd. (3107.T) Bundle
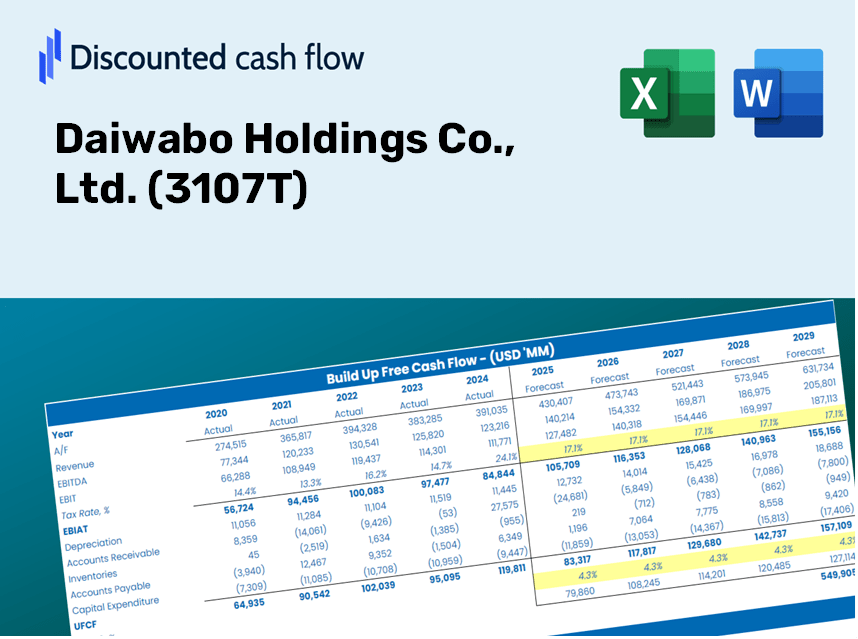
Gagnez la maîtrise sur votre analyse d'évaluation Daiwabo Holdings Co., Ltd. (3107T) utilisant notre calculatrice sophistiquée DCF! Ce modèle Excel est préchargé avec des données réelles (3107T), vous permettant d'ajuster les prévisions et les hypothèses pour déterminer avec précision la valeur intrinsèque de Daiwabo Holdings Co., Ltd.
Discounted Cash Flow (DCF) - (USD MM)
| Year | AY1 2020 |
AY2 2021 |
AY3 2022 |
AY4 2023 |
AY5 2024 |
FY1 2025 |
FY2 2026 |
FY3 2027 |
FY4 2028 |
FY5 2029 |
|---|---|---|---|---|---|---|---|---|---|---|
| Revenue | 1,043,534.0 | 763,838.0 | 903,918.0 | 967,760.0 | 1,136,817.0 | 1,182,482.7 | 1,229,982.7 | 1,279,390.8 | 1,330,783.7 | 1,384,240.9 |
| Revenue Growth, % | 0 | -26.8 | 18.34 | 7.06 | 17.47 | 4.02 | 4.02 | 4.02 | 4.02 | 4.02 |
| EBITDA | 40,313.0 | 28,679.0 | 31,767.0 | 17,228.0 | 38,081.0 | 38,459.2 | 40,004.1 | 41,611.1 | 43,282.6 | 45,021.2 |
| EBITDA, % | 3.86 | 3.75 | 3.51 | 1.78 | 3.35 | 3.25 | 3.25 | 3.25 | 3.25 | 3.25 |
| Depreciation | 3,785.0 | 3,497.0 | 3,381.0 | 3,440.0 | 1,862.0 | 4,053.1 | 4,215.9 | 4,385.3 | 4,561.4 | 4,744.7 |
| Depreciation, % | 0.36271 | 0.45782 | 0.37404 | 0.35546 | 0.16379 | 0.34276 | 0.34276 | 0.34276 | 0.34276 | 0.34276 |
| EBIT | 36,528.0 | 25,182.0 | 28,386.0 | 13,788.0 | 36,219.0 | 34,406.1 | 35,788.2 | 37,225.8 | 38,721.1 | 40,276.6 |
| EBIT, % | 3.5 | 3.3 | 3.14 | 1.42 | 3.19 | 2.91 | 2.91 | 2.91 | 2.91 | 2.91 |
| Total Cash | 32,058.0 | 46,963.0 | 52,123.0 | 69,372.0 | 55,421.0 | 63,925.3 | 66,493.1 | 69,164.1 | 71,942.4 | 74,832.4 |
| Total Cash, percent | .0 | .0 | .0 | .0 | .0 | .0 | .0 | .0 | .0 | .0 |
| Account Receivables | 246,753.0 | 202,111.0 | 239,692.0 | 257,009.0 | 288,456.0 | 304,025.6 | 316,238.3 | 328,941.5 | 342,155.0 | 355,899.3 |
| Account Receivables, % | 23.65 | 26.46 | 26.52 | 26.56 | 25.37 | 25.71 | 25.71 | 25.71 | 25.71 | 25.71 |
| Inventories | 37,995.0 | 43,590.0 | 45,047.0 | 36,450.0 | 48,941.0 | 52,981.7 | 55,110.0 | 57,323.7 | 59,626.4 | 62,021.6 |
| Inventories, % | 3.64 | 5.71 | 4.98 | 3.77 | 4.31 | 4.48 | 4.48 | 4.48 | 4.48 | 4.48 |
| Accounts Payable | 188,483.0 | 161,859.0 | 192,594.0 | 206,212.0 | 228,422.0 | 241,132.1 | 250,818.3 | 260,893.6 | 271,373.6 | 282,274.7 |
| Accounts Payable, % | 18.06 | 21.19 | 21.31 | 21.31 | 20.09 | 20.39 | 20.39 | 20.39 | 20.39 | 20.39 |
| Capital Expenditure | -3,122.0 | -3,126.0 | -2,021.0 | -2,726.0 | -1,925.0 | -3,270.8 | -3,402.2 | -3,538.8 | -3,681.0 | -3,828.9 |
| Capital Expenditure, % | -0.29918 | -0.40925 | -0.22358 | -0.28168 | -0.16933 | -0.2766 | -0.2766 | -0.2766 | -0.2766 | -0.2766 |
| Tax Rate, % | 31.23 | 31.23 | 31.23 | 31.23 | 31.23 | 31.23 | 31.23 | 31.23 | 31.23 | 31.23 |
| EBITAT | 25,910.1 | 17,168.7 | 19,190.8 | 4,345.4 | 24,908.5 | 21,125.7 | 21,974.3 | 22,857.0 | 23,775.2 | 24,730.2 |
| Depreciation | ||||||||||
| Changes in Account Receivables | ||||||||||
| Changes in Inventories | ||||||||||
| Changes in Accounts Payable | ||||||||||
| Capital Expenditure | ||||||||||
| UFCF | -69,691.9 | 29,962.7 | 12,247.8 | 9,957.4 | 3,117.5 | 15,007.7 | 18,133.4 | 18,861.8 | 19,619.4 | 20,407.6 |
| WACC, % | 4.86 | 4.85 | 4.85 | 4.76 | 4.86 | 4.84 | 4.84 | 4.84 | 4.84 | 4.84 |
| PV UFCF | ||||||||||
| SUM PV UFCF | 79,542.8 | |||||||||
| Long Term Growth Rate, % | 3.00 | |||||||||
| Free cash flow (T + 1) | 21,020 | |||||||||
| Terminal Value | 1,145,080 | |||||||||
| Present Terminal Value | 904,255 | |||||||||
| Enterprise Value | 983,797 | |||||||||
| Net Debt | -34,718 | |||||||||
| Equity Value | 1,018,515 | |||||||||
| Diluted Shares Outstanding, MM | 91 | |||||||||
| Equity Value Per Share | 11,166.83 |
Benefits of Choosing Daiwabo Holdings (3107T)
- Comprehensive Financial Model: Leverage Daiwabo's actual performance data for accurate DCF valuation.
- Complete Forecast Customization: Modify revenue growth rates, profit margins, WACC, and other critical variables.
- Real-Time Calculations: Enjoy automatic updates that reflect changes in your inputs instantly.
- Professional-Grade Template: An expertly crafted Excel file prepared for investor presentations and evaluations.
- Flexible and Reusable: Designed for adaptability, making it easy to generate detailed forecasts multiple times.
Key Features
- Advanced DCF Calculator: Features comprehensive unlevered and levered DCF valuation models tailored for Daiwabo Holdings Co., Ltd. (3107T).
- WACC Calculator: Comes with a pre-configured Weighted Average Cost of Capital sheet, allowing for adjustable inputs.
- Customizable Forecast Assumptions: Adjust growth rates, capital expenditures, and discount rates as needed.
- Integrated Financial Ratios: Evaluate profitability, leverage, and efficiency ratios specifically for Daiwabo Holdings Co., Ltd. (3107T).
- Dashboard and Charts: Visual representations provide a summary of key valuation metrics for straightforward analysis.
How It Functions
- Download: Obtain the comprehensive Excel file featuring Daiwabo Holdings Co., Ltd.'s (3107T) financial data.
- Customize: Tailor your forecasts, including revenue growth, EBITDA margin, and WACC.
- Update Automatically: Enjoy real-time updates for intrinsic value and NPV calculations.
- Test Scenarios: Develop various projections and assess outcomes instantly.
- Make Decisions: Utilize the valuation results to inform your investment strategy.
Why Choose Daiwabo Holdings Co., Ltd. (3107T)?
- Save Time: Skip the hassle of building a financial model from the ground up – our tools are ready for immediate use.
- Enhance Accuracy: Access to dependable financial data and formulas minimizes valuation errors.
- Fully Customizable: Adapt the model to align with your specific assumptions and projections.
- Easy to Understand: Intuitive charts and outputs ensure that results are straightforward to analyze.
- Endorsed by Professionals: Crafted for experts who prioritize both precision and ease of use.
Who Can Benefit from Daiwabo Holdings Co., Ltd. (3107T)?
- Investors: Make informed investment choices with a sophisticated valuation tool tailored for your needs.
- Financial Analysts: Enhance your efficiency with a customizable DCF model that saves you time.
- Consultants: Seamlessly modify the template for impactful client presentations or detailed reports.
- Finance Enthusiasts: Expand your knowledge of valuation methodologies through practical, real-world examples.
- Educators and Students: Utilize this resource as a hands-on learning aid in finance courses.
Contents of the Template
- Operating and Balance Sheet Data: Pre-filled historical data and forecasts for Daiwabo Holdings Co., Ltd. (3107T), including metrics such as revenue, EBITDA, EBIT, and capital expenditures.
- WACC Calculation: A dedicated sheet for calculating the Weighted Average Cost of Capital (WACC), featuring parameters like Beta, risk-free rate, and share price.
- DCF Valuation (Unlevered and Levered): Customizable Discounted Cash Flow models that present intrinsic value with comprehensive calculations.
- Financial Statements: Pre-loaded annual and quarterly financial statements to facilitate thorough analysis.
- Key Ratios: A collection of profitability, leverage, and efficiency ratios specifically for Daiwabo Holdings Co., Ltd. (3107T).
- Dashboard and Charts: A visual overview of valuation outputs and underlying assumptions for straightforward analysis of results.
Disclaimer
All information, articles, and product details provided on this website are for general informational and educational purposes only. We do not claim any ownership over, nor do we intend to infringe upon, any trademarks, copyrights, logos, brand names, or other intellectual property mentioned or depicted on this site. Such intellectual property remains the property of its respective owners, and any references here are made solely for identification or informational purposes, without implying any affiliation, endorsement, or partnership.
We make no representations or warranties, express or implied, regarding the accuracy, completeness, or suitability of any content or products presented. Nothing on this website should be construed as legal, tax, investment, financial, medical, or other professional advice. In addition, no part of this site—including articles or product references—constitutes a solicitation, recommendation, endorsement, advertisement, or offer to buy or sell any securities, franchises, or other financial instruments, particularly in jurisdictions where such activity would be unlawful.
All content is of a general nature and may not address the specific circumstances of any individual or entity. It is not a substitute for professional advice or services. Any actions you take based on the information provided here are strictly at your own risk. You accept full responsibility for any decisions or outcomes arising from your use of this website and agree to release us from any liability in connection with your use of, or reliance upon, the content or products found herein.