
|
Toyota Boshoku Corporation (3116.T) Évaluation DCF |
Entièrement Modifiable: Adapté À Vos Besoins Dans Excel Ou Sheets
Conception Professionnelle: Modèles Fiables Et Conformes Aux Normes Du Secteur
Pré-Construits Pour Une Utilisation Rapide Et Efficace
Compatible MAC/PC, entièrement débloqué
Aucune Expertise N'Est Requise; Facile À Suivre
Toyota Boshoku Corporation (3116.T) Bundle
Évaluez les perspectives financières de la Toyota Boshoku Corporation comme un expert! Ce (3116t) Calculator DCF vous fournit des finances pré-remplies et offre une flexibilité totale pour modifier la croissance des revenus, le WACC, les marges et d'autres hypothèses essentielles pour s'aligner sur vos projections.
What You Will Receive
- Authentic 3116T Financial Data: Access to historical and projected figures for precise valuation.
- Customizable Parameters: Adjust WACC, tax rates, revenue growth, and capital expenditures to suit your analysis.
- Real-Time Calculations: Dynamic computation of intrinsic value and NPV.
- Scenario Planning: Evaluate various scenarios to assess Toyota Boshoku's future prospects.
- User-Friendly Interface: Designed for professionals while remaining accessible to newcomers.
Key Features
- Real-Life 3116T Data: Pre-populated with Toyota Boshoku Corporation’s historical financial data and future projections.
- Fully Customizable Inputs: Modify revenue growth rates, profit margins, WACC, tax rates, and capital expenditures to fit your analysis.
- Dynamic Valuation Model: Instantaneous updates to Net Present Value (NPV) and intrinsic value in response to your adjustments.
- Scenario Testing: Develop various forecasting scenarios to evaluate different valuation results.
- User-Friendly Design: Intuitive and organized layout that caters to both professionals and beginners.
How It Works
- Step 1: Download the prebuilt Excel template featuring Toyota Boshoku Corporation's data.
- Step 2: Review the pre-filled sheets to familiarize yourself with the essential metrics.
- Step 3: Modify forecasts and assumptions in the editable yellow cells (WACC, growth, margins).
- Step 4: Immediately see recalculated results, including Toyota Boshoku Corporation's intrinsic value.
- Step 5: Use the outputs to make informed investment decisions or create reports.
Why Opt for This Calculator?
- Designed for Experts: A sophisticated tool utilized by analysts, CFOs, and consultants.
- Accurate Data: Toyota Boshoku Corporation's historical and projected financials are preloaded for precision.
- Scenario Analysis: Effortlessly simulate various forecasts and assumptions.
- Clear Results: Automatically computes intrinsic value, NPV, and essential metrics.
- User-Friendly: Step-by-step guidance assists you throughout the entire process.
Who Can Benefit from This Product?
- Investors: Make informed decisions with a high-quality valuation tool tailored for precision.
- Financial Analysts: Streamline your workflow with a customizable DCF model that's ready to use.
- Consultants: Effortlessly modify the template for client pitches or detailed reports.
- Finance Enthusiasts: Enhance your grasp of valuation methodologies through practical, real-life examples.
- Educators and Students: Utilize this as an effective learning resource in finance-focused studies.
For those interested, the product is specifically designed for Toyota Boshoku Corporation (3116T).
Contents of the Template
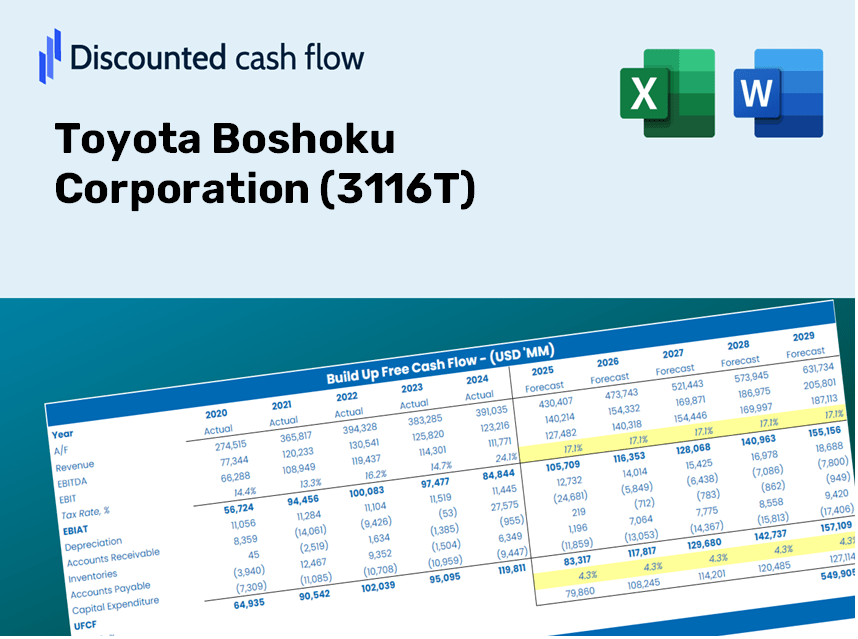
- Preloaded TYC Data: Historical and projected financial figures, including revenue, EBIT, and capital expenditures.
- DCF and WACC Models: Sophisticated sheets designed for determining intrinsic value and Weighted Average Cost of Capital.
- Editable Inputs: Yellow-highlighted fields for customizing revenue growth, tax rates, and discount rates.
- Financial Statements: Detailed annual and quarterly financial reports for in-depth analysis.
- Key Ratios: Metrics on profitability, leverage, and efficiency to assess overall performance.
- Dashboard and Charts: Visual representations of valuation results and underlying assumptions.
Disclaimer
All information, articles, and product details provided on this website are for general informational and educational purposes only. We do not claim any ownership over, nor do we intend to infringe upon, any trademarks, copyrights, logos, brand names, or other intellectual property mentioned or depicted on this site. Such intellectual property remains the property of its respective owners, and any references here are made solely for identification or informational purposes, without implying any affiliation, endorsement, or partnership.
We make no representations or warranties, express or implied, regarding the accuracy, completeness, or suitability of any content or products presented. Nothing on this website should be construed as legal, tax, investment, financial, medical, or other professional advice. In addition, no part of this site—including articles or product references—constitutes a solicitation, recommendation, endorsement, advertisement, or offer to buy or sell any securities, franchises, or other financial instruments, particularly in jurisdictions where such activity would be unlawful.
All content is of a general nature and may not address the specific circumstances of any individual or entity. It is not a substitute for professional advice or services. Any actions you take based on the information provided here are strictly at your own risk. You accept full responsibility for any decisions or outcomes arising from your use of this website and agree to release us from any liability in connection with your use of, or reliance upon, the content or products found herein.