
|
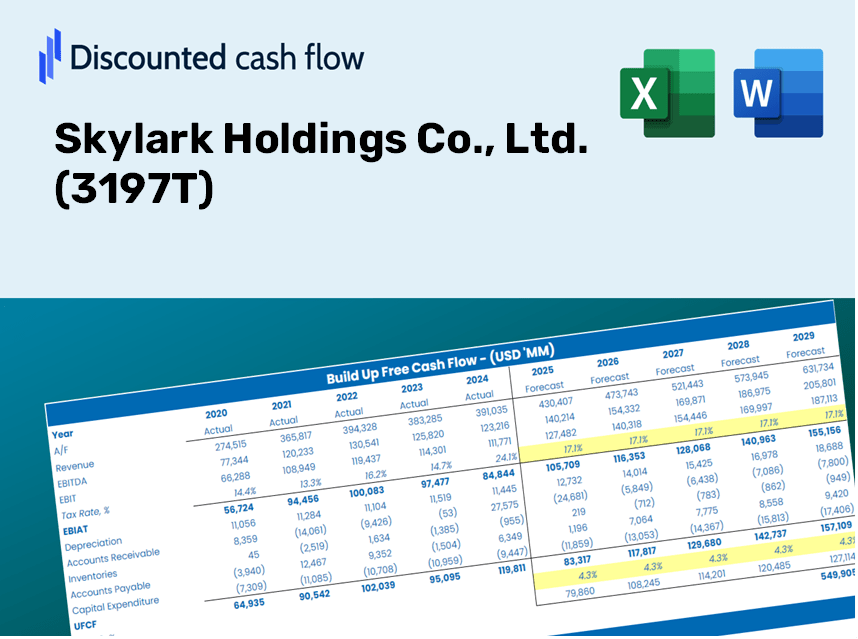
Skylark Holdings Co., Ltd. (3197.T) Évaluation DCF |
Entièrement Modifiable: Adapté À Vos Besoins Dans Excel Ou Sheets
Conception Professionnelle: Modèles Fiables Et Conformes Aux Normes Du Secteur
Pré-Construits Pour Une Utilisation Rapide Et Efficace
Compatible MAC/PC, entièrement débloqué
Aucune Expertise N'Est Requise; Facile À Suivre
Skylark Holdings Co., Ltd. (3197.T) Bundle
Découvrez le véritable potentiel de Skylark Holdings Co., Ltd. (3197T) avec notre calculatrice avancée DCF! Ajustez les hypothèses clés, explorez divers scénarios et évaluez comment les modifications affectent l'évaluation de Skylark Holdings Co., Ltd. (3197T) - toutes dans un modèle Excel pratique.
Discounted Cash Flow (DCF) - (USD MM)
| Year | AY1 2020 |
AY2 2021 |
AY3 2022 |
AY4 2023 |
AY5 2024 |
FY1 2025 |
FY2 2026 |
FY3 2027 |
FY4 2028 |
FY5 2029 |
|---|---|---|---|---|---|---|---|---|---|---|
| Revenue | 288,434.0 | 264,570.0 | 303,705.0 | 354,831.0 | 401,130.0 | 382,032.2 | 363,843.7 | 346,521.2 | 330,023.3 | 314,311.0 |
| Revenue Growth, % | 0 | -8.27 | 14.79 | 16.83 | 13.05 | -4.76 | -4.76 | -4.76 | -4.76 | -4.76 |
| EBITDA | 35,444.0 | 65,717.0 | 41,988.0 | 66,327.0 | 72,684.0 | 67,058.3 | 63,865.7 | 60,825.0 | 57,929.1 | 55,171.1 |
| EBITDA, % | 12.29 | 24.84 | 13.83 | 18.69 | 18.12 | 17.55 | 17.55 | 17.55 | 17.55 | 17.55 |
| Depreciation | 51,168.0 | 47,511.0 | 47,572.0 | 48,649.0 | 47,827.0 | 58,829.3 | 56,028.4 | 53,360.9 | 50,820.4 | 48,400.9 |
| Depreciation, % | 17.74 | 17.96 | 15.66 | 13.71 | 11.92 | 15.4 | 15.4 | 15.4 | 15.4 | 15.4 |
| EBIT | -15,724.0 | 18,206.0 | -5,584.0 | 17,678.0 | 24,857.0 | 8,229.0 | 7,837.2 | 7,464.1 | 7,108.7 | 6,770.3 |
| EBIT, % | -5.45 | 6.88 | -1.84 | 4.98 | 6.2 | 2.15 | 2.15 | 2.15 | 2.15 | 2.15 |
| Total Cash | 17,076.0 | 38,381.0 | 15,344.0 | 26,790.0 | 19,263.0 | 28,905.9 | 27,529.7 | 26,219.0 | 24,970.7 | 23,781.8 |
| Total Cash, percent | .0 | .0 | .0 | .0 | .0 | .0 | .0 | .0 | .0 | .0 |
| Account Receivables | 13,588.0 | 24,247.0 | 16,943.0 | 17,038.0 | 20,808.0 | 22,496.7 | 21,425.6 | 20,405.6 | 19,434.1 | 18,508.8 |
| Account Receivables, % | 4.71 | 9.16 | 5.58 | 4.8 | 5.19 | 5.89 | 5.89 | 5.89 | 5.89 | 5.89 |
| Inventories | 4,304.0 | 3,972.0 | 7,335.0 | 5,927.0 | 7,772.0 | 6,889.2 | 6,561.2 | 6,248.9 | 5,951.4 | 5,668.0 |
| Inventories, % | 1.49 | 1.5 | 2.42 | 1.67 | 1.94 | 1.8 | 1.8 | 1.8 | 1.8 | 1.8 |
| Accounts Payable | 8,157.0 | 10,582.0 | 10,675.0 | 26,500.0 | 32,558.0 | 19,810.3 | 18,867.2 | 17,968.9 | 17,113.4 | 16,298.6 |
| Accounts Payable, % | 2.83 | 4 | 3.51 | 7.47 | 8.12 | 5.19 | 5.19 | 5.19 | 5.19 | 5.19 |
| Capital Expenditure | -15,770.0 | -13,235.0 | -15,788.0 | -14,847.0 | -15,096.0 | -18,044.1 | -17,185.1 | -16,366.9 | -15,587.7 | -14,845.5 |
| Capital Expenditure, % | -5.47 | -5 | -5.2 | -4.18 | -3.76 | -4.72 | -4.72 | -4.72 | -4.72 | -4.72 |
| Tax Rate, % | 34.96 | 34.96 | 34.96 | 34.96 | 34.96 | 34.96 | 34.96 | 34.96 | 34.96 | 34.96 |
| EBITAT | -10,240.0 | 11,110.4 | -4,325.3 | 9,724.8 | 16,168.0 | 5,326.9 | 5,073.3 | 4,831.7 | 4,601.7 | 4,382.6 |
| Depreciation | ||||||||||
| Changes in Account Receivables | ||||||||||
| Changes in Inventories | ||||||||||
| Changes in Accounts Payable | ||||||||||
| Capital Expenditure | ||||||||||
| UFCF | 15,423.0 | 37,484.4 | 31,492.7 | 60,664.8 | 49,342.0 | 32,558.4 | 44,372.5 | 42,259.9 | 40,247.9 | 38,331.7 |
| WACC, % | 4.23 | 4.21 | 4.29 | 4.18 | 4.23 | 4.23 | 4.23 | 4.23 | 4.23 | 4.23 |
| PV UFCF | ||||||||||
| SUM PV UFCF | 174,658.9 | |||||||||
| Long Term Growth Rate, % | 3.00 | |||||||||
| Free cash flow (T + 1) | 39,482 | |||||||||
| Terminal Value | 3,207,691 | |||||||||
| Present Terminal Value | 2,607,421 | |||||||||
| Enterprise Value | 2,782,080 | |||||||||
| Net Debt | 87,161 | |||||||||
| Equity Value | 2,694,919 | |||||||||
| Diluted Shares Outstanding, MM | 228 | |||||||||
| Equity Value Per Share | 11,845.69 |
Benefits of Choosing Skylark Holdings Co., Ltd. (3197T)
- Comprehensive SHLD Financials: Access to both historical data and forecasts for precise valuation insights.
- Customizable Parameters: Adjust inputs like WACC, tax rates, revenue growth, and capital expenditures to suit your analysis.
- Real-Time Calculations: Intrinsic value and NPV are computed automatically as you input your data.
- Scenario Simulation: Evaluate various scenarios to assess Skylark’s potential future performance.
- User-Friendly Interface: Designed for industry professionals while ensuring ease of use for newcomers.
Key Features
- 🔍 Real-Life Skylark Financials: Pre-filled historical and projected data for Skylark Holdings Co., Ltd. (3197T).
- ✏️ Fully Customizable Inputs: Adjust all essential parameters (yellow cells) such as WACC, growth %, and tax rates.
- 📊 Professional DCF Valuation: Built-in formulas calculate the intrinsic value of Skylark using the Discounted Cash Flow method.
- ⚡ Instant Results: Visualize Skylark’s valuation immediately after making adjustments.
- Scenario Analysis: Evaluate and compare outcomes for different financial assumptions side-by-side.
How It Works
- Step 1: Download the Excel spreadsheet.
- Step 2: Examine Skylark Holdings Co., Ltd.'s pre-filled financial information and projections.
- Step 3: Adjust key inputs such as revenue growth, WACC, and tax rates (highlighted cells).
- Step 4: Observe the DCF model refresh in real-time as you modify your assumptions.
- Step 5: Evaluate the outputs and leverage the findings for your investment strategies.
Why Opt for This Skylark Holdings Calculator?
- Reliable Data: Utilizes authentic Skylark Holdings financials for trustworthy valuation outcomes.
- Tailorable: Modify essential parameters like growth rates, WACC, and tax rates to fit your forecasts.
- Efficient: Pre-configured calculations save you the hassle of starting from scratch.
- Expert-Grade Tool: Crafted for investors, analysts, and consultants alike.
- User-Friendly: Simple design and guided instructions ensure accessibility for all users.
Who Can Benefit from This Product?
- Investors: Evaluate the valuation of Skylark Holdings (3197T) prior to making stock transactions.
- CFOs and Financial Analysts: Optimize valuation workflows and assess financial forecasts.
- Startup Founders: Understand the valuation methodologies used by established companies like Skylark Holdings.
- Consultants: Provide comprehensive valuation reports to your clientele.
- Students and Educators: Utilize real-life data to practice and instruct on valuation strategies.
Contents of the Template
- Detailed DCF Model: An editable template featuring comprehensive valuation computations.
- Real-Time Data: Skylark Holdings Co., Ltd. (3197T) historical and projected financial data preloaded for in-depth analysis.
- Adjustable Parameters: Customize WACC, growth rates, and tax assumptions for scenario testing.
- Financial Statements: Complete annual and quarterly reports for enhanced insights.
- Key Financial Ratios: Integrated analysis for profitability, efficiency, and leverage metrics.
- Interactive Dashboard: Visual outputs including charts and tables for clear and actionable insights.
Disclaimer
All information, articles, and product details provided on this website are for general informational and educational purposes only. We do not claim any ownership over, nor do we intend to infringe upon, any trademarks, copyrights, logos, brand names, or other intellectual property mentioned or depicted on this site. Such intellectual property remains the property of its respective owners, and any references here are made solely for identification or informational purposes, without implying any affiliation, endorsement, or partnership.
We make no representations or warranties, express or implied, regarding the accuracy, completeness, or suitability of any content or products presented. Nothing on this website should be construed as legal, tax, investment, financial, medical, or other professional advice. In addition, no part of this site—including articles or product references—constitutes a solicitation, recommendation, endorsement, advertisement, or offer to buy or sell any securities, franchises, or other financial instruments, particularly in jurisdictions where such activity would be unlawful.
All content is of a general nature and may not address the specific circumstances of any individual or entity. It is not a substitute for professional advice or services. Any actions you take based on the information provided here are strictly at your own risk. You accept full responsibility for any decisions or outcomes arising from your use of this website and agree to release us from any liability in connection with your use of, or reliance upon, the content or products found herein.