
|
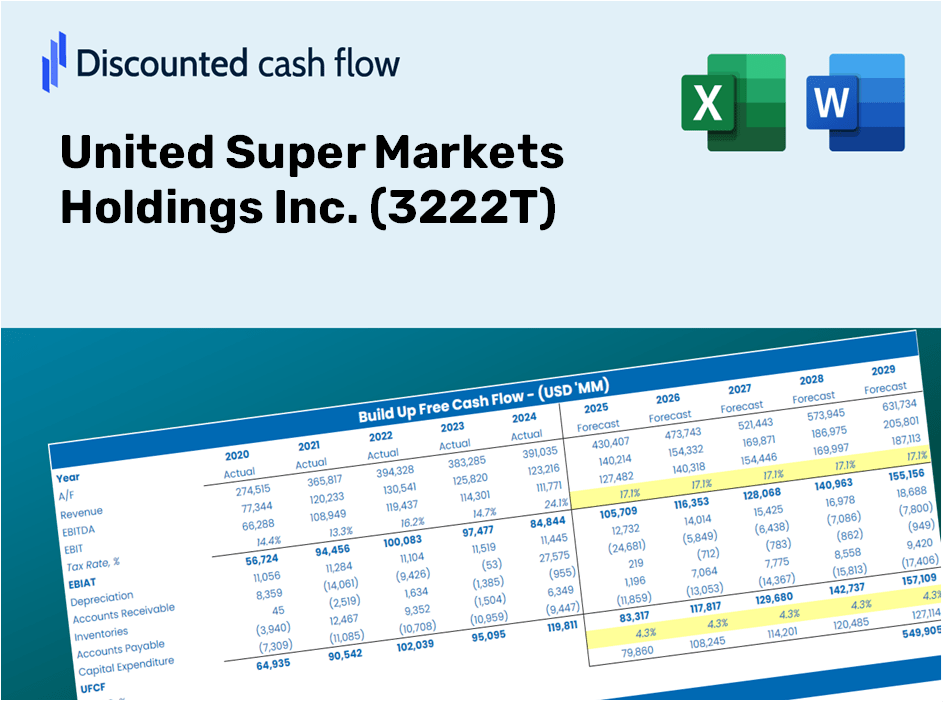
United Super Markets Holdings Inc. (3222.T) Évaluation DCF |
Entièrement Modifiable: Adapté À Vos Besoins Dans Excel Ou Sheets
Conception Professionnelle: Modèles Fiables Et Conformes Aux Normes Du Secteur
Pré-Construits Pour Une Utilisation Rapide Et Efficace
Compatible MAC/PC, entièrement débloqué
Aucune Expertise N'Est Requise; Facile À Suivre
United Super Markets Holdings Inc. (3222.T) Bundle
Vous cherchez à évaluer la valeur intrinsèque de United Super Markets Holdings Inc.? Notre (3222T) Calculator DCF intègre des données réelles avec des fonctionnalités de personnalisation approfondies, vous permettant d'affiner vos prévisions et d'améliorer vos choix d'investissement.
Discounted Cash Flow (DCF) - (USD MM)
| Year | AY1 2020 |
AY2 2021 |
AY3 2022 |
AY4 2023 |
AY5 2024 |
FY1 2025 |
FY2 2026 |
FY3 2027 |
FY4 2028 |
FY5 2029 |
|---|---|---|---|---|---|---|---|---|---|---|
| Revenue | 733,849.0 | 716,407.0 | 708,690.0 | 706,657.0 | 811,272.0 | 833,710.5 | 856,769.7 | 880,466.6 | 904,818.9 | 929,844.8 |
| Revenue Growth, % | 0 | -2.38 | -1.08 | -0.28687 | 14.8 | 2.77 | 2.77 | 2.77 | 2.77 | 2.77 |
| EBITDA | 28,019.0 | 23,652.0 | 18,179.0 | 18,554.0 | 24,536.0 | 25,569.4 | 26,276.6 | 27,003.4 | 27,750.3 | 28,517.8 |
| EBITDA, % | 3.82 | 3.3 | 2.57 | 2.63 | 3.02 | 3.07 | 3.07 | 3.07 | 3.07 | 3.07 |
| Depreciation | 12,987.0 | 13,784.0 | 14,405.0 | 14,722.0 | 17,284.0 | 16,574.5 | 17,032.9 | 17,504.0 | 17,988.1 | 18,485.7 |
| Depreciation, % | 1.77 | 1.92 | 2.03 | 2.08 | 2.13 | 1.99 | 1.99 | 1.99 | 1.99 | 1.99 |
| EBIT | 15,032.0 | 9,868.0 | 3,774.0 | 3,832.0 | 7,252.0 | 8,994.9 | 9,243.7 | 9,499.4 | 9,762.1 | 10,032.1 |
| EBIT, % | 2.05 | 1.38 | 0.53253 | 0.54227 | 0.8939 | 1.08 | 1.08 | 1.08 | 1.08 | 1.08 |
| Total Cash | 38,119.0 | 32,499.0 | 25,633.0 | 21,135.0 | 35,737.0 | 34,588.4 | 35,545.0 | 36,528.2 | 37,538.5 | 38,576.7 |
| Total Cash, percent | .0 | .0 | .0 | .0 | .0 | .0 | .0 | .0 | .0 | .0 |
| Account Receivables | 30,715.0 | 27,219.0 | 28,772.0 | 30,402.0 | 37,820.0 | 35,030.5 | 35,999.4 | 36,995.0 | 38,018.3 | 39,069.8 |
| Account Receivables, % | 4.19 | 3.8 | 4.06 | 4.3 | 4.66 | 4.2 | 4.2 | 4.2 | 4.2 | 4.2 |
| Inventories | 14,974.0 | 16,199.0 | 17,453.0 | 17,039.0 | 23,764.0 | 20,183.8 | 20,742.0 | 21,315.7 | 21,905.3 | 22,511.1 |
| Inventories, % | 2.04 | 2.26 | 2.46 | 2.41 | 2.93 | 2.42 | 2.42 | 2.42 | 2.42 | 2.42 |
| Accounts Payable | 50,949.0 | 50,067.0 | 48,641.0 | 48,671.0 | 60,613.0 | 58,616.0 | 60,237.2 | 61,903.3 | 63,615.5 | 65,375.0 |
| Accounts Payable, % | 6.94 | 6.99 | 6.86 | 6.89 | 7.47 | 7.03 | 7.03 | 7.03 | 7.03 | 7.03 |
| Capital Expenditure | -17,006.0 | -24,488.0 | -20,531.0 | -23,861.0 | -22,679.0 | -24,685.6 | -25,368.4 | -26,070.0 | -26,791.1 | -27,532.1 |
| Capital Expenditure, % | -2.32 | -3.42 | -2.9 | -3.38 | -2.8 | -2.96 | -2.96 | -2.96 | -2.96 | -2.96 |
| Tax Rate, % | 88.27 | 88.27 | 88.27 | 88.27 | 88.27 | 88.27 | 88.27 | 88.27 | 88.27 | 88.27 |
| EBITAT | 8,921.0 | 5,456.4 | 1,392.1 | 1,057.1 | 850.7 | 3,433.2 | 3,528.2 | 3,625.8 | 3,726.1 | 3,829.1 |
| Depreciation | ||||||||||
| Changes in Account Receivables | ||||||||||
| Changes in Inventories | ||||||||||
| Changes in Accounts Payable | ||||||||||
| Capital Expenditure | ||||||||||
| UFCF | 10,162.0 | -3,858.6 | -8,966.9 | -9,267.9 | -6,745.3 | -305.1 | -4,713.2 | -4,843.5 | -4,977.5 | -5,115.2 |
| WACC, % | 3.9 | 3.85 | 3.64 | 3.53 | 3.35 | 3.66 | 3.66 | 3.66 | 3.66 | 3.66 |
| PV UFCF | ||||||||||
| SUM PV UFCF | -17,615.5 | |||||||||
| Long Term Growth Rate, % | 3.40 | |||||||||
| Free cash flow (T + 1) | -5,289 | |||||||||
| Terminal Value | -2,060,857 | |||||||||
| Present Terminal Value | -1,722,115 | |||||||||
| Enterprise Value | -1,739,731 | |||||||||
| Net Debt | 29,891 | |||||||||
| Equity Value | -1,769,622 | |||||||||
| Diluted Shares Outstanding, MM | 149 | |||||||||
| Equity Value Per Share | -11,854.52 |
What You Will Receive
- Genuine (3222T) Financial Data: Comprehensive historical and projected information for precise valuation.
- Customizable Parameters: Adjust WACC, tax rates, revenue growth, and capital expenditures as needed.
- Automatic Calculations: Intrinsic value and NPV are computed in real-time.
- Scenario Analysis: Explore various scenarios to assess United Super Markets Holdings Inc.'s future performance.
- User-Friendly Design: Crafted for professionals while remaining approachable for newcomers.
Key Features
- Pre-Loaded Data: Historical financial statements and forecasts for United Super Markets Holdings Inc. (3222T).
- Fully Adjustable Inputs: Modify WACC, tax rates, revenue growth, and EBITDA margins to fit your analysis.
- Instant Results: Watch United Super Markets Holdings Inc.'s (3222T) intrinsic value update in real time.
- Clear Visual Outputs: Intuitive dashboard charts present valuation results and essential metrics.
- Built for Accuracy: A reliable tool designed for analysts, investors, and finance professionals.
How It Operates
- Download: Obtain the pre-configured Excel file containing United Super Markets Holdings Inc.’s (3222T) financial data.
- Customize: Modify projections, including sales growth, EBITDA margin, and WACC.
- Update Instantly: Real-time updates for intrinsic value and NPV calculations.
- Test Scenarios: Develop various projections and instantly analyze the results.
- Make Informed Decisions: Leverage the valuation insights to shape your investment approach.
Why Choose This Calculator for United Super Markets Holdings Inc. (3222T)?
- Reliable Data: Access accurate financial information for United Super Markets ensures dependable valuation outcomes.
- Tailored Options: Modify essential variables such as growth rates, WACC, and tax rates to fit your forecasts.
- Efficient: Ready-made calculations save you the hassle of starting from the ground up.
- Professional Tool: Crafted for investors, analysts, and consultants alike.
- Easy to Use: User-friendly design and clear, step-by-step guidance make it accessible to everyone.
Who Can Benefit from This Product?
- Individual Investors: Gain valuable insights for making decisions about buying or selling United Super Markets Holdings Inc. (3222T) stock.
- Financial Analysts: Enhance valuation procedures using ready-to-implement financial models specific to the grocery sector.
- Consultants: Provide clients with accurate and timely valuation analyses for United Super Markets Holdings Inc. (3222T).
- Business Owners: Learn how large retail entities like United Super Markets Holdings Inc. (3222T) are appraised to inform your own business strategies.
- Finance Students: Explore valuation methodologies using real data and case studies related to United Super Markets Holdings Inc. (3222T).
Overview of the Template Features
- In-Depth DCF Model: Customizable template featuring extensive valuation calculations.
- Current Financial Data: United Super Markets Holdings Inc.’s historical and projected financial information preloaded for in-depth analysis.
- Adjustable Assumptions: Modify WACC, growth rates, and tax inputs to explore various scenarios.
- Detailed Financial Statements: Complete annual and quarterly breakdowns for enhanced insights.
- Essential Ratios: Integrated analysis for profitability, efficiency, and leverage metrics.
- Visual Dashboard: Graphs and tables designed for clear, actionable insights.
Disclaimer
All information, articles, and product details provided on this website are for general informational and educational purposes only. We do not claim any ownership over, nor do we intend to infringe upon, any trademarks, copyrights, logos, brand names, or other intellectual property mentioned or depicted on this site. Such intellectual property remains the property of its respective owners, and any references here are made solely for identification or informational purposes, without implying any affiliation, endorsement, or partnership.
We make no representations or warranties, express or implied, regarding the accuracy, completeness, or suitability of any content or products presented. Nothing on this website should be construed as legal, tax, investment, financial, medical, or other professional advice. In addition, no part of this site—including articles or product references—constitutes a solicitation, recommendation, endorsement, advertisement, or offer to buy or sell any securities, franchises, or other financial instruments, particularly in jurisdictions where such activity would be unlawful.
All content is of a general nature and may not address the specific circumstances of any individual or entity. It is not a substitute for professional advice or services. Any actions you take based on the information provided here are strictly at your own risk. You accept full responsibility for any decisions or outcomes arising from your use of this website and agree to release us from any liability in connection with your use of, or reliance upon, the content or products found herein.