
|
Hoshino Resorts REIT, Inc. (3287.T) Évaluation DCF |
Entièrement Modifiable: Adapté À Vos Besoins Dans Excel Ou Sheets
Conception Professionnelle: Modèles Fiables Et Conformes Aux Normes Du Secteur
Pré-Construits Pour Une Utilisation Rapide Et Efficace
Compatible MAC/PC, entièrement débloqué
Aucune Expertise N'Est Requise; Facile À Suivre
Hoshino Resorts REIT, Inc. (3287.T) Bundle
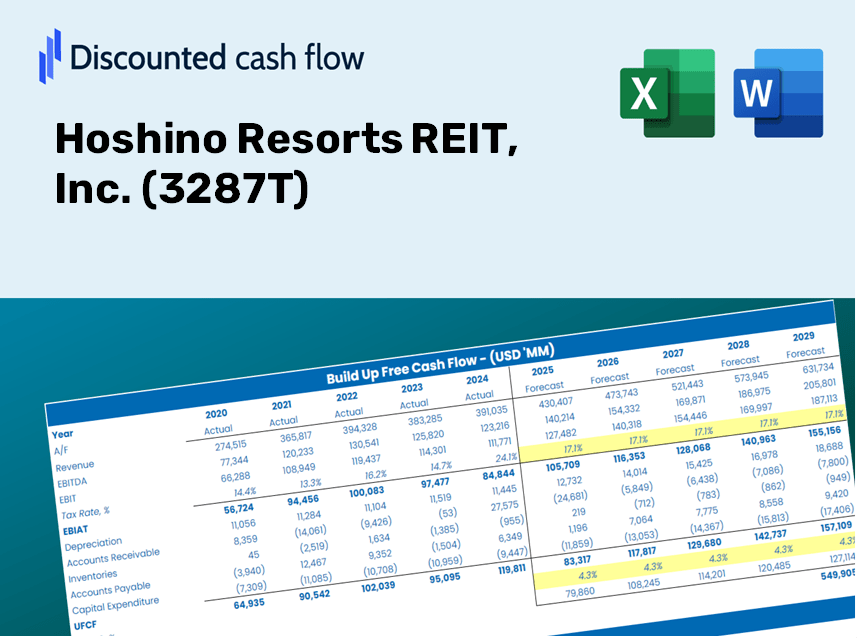
Améliorez vos stratégies d'investissement avec la calculatrice DCF Hoshino Resorts REIT, Inc. (3287T)! Utilisez de véritables données financières de Hoshino Resorts, ajustez les prévisions et les dépenses de croissance et observez instantanément comment ces changements affectent la valeur intrinsèque de Hoshino Resorts Reit, Inc. (3287T).
Discounted Cash Flow (DCF) - (USD MM)
| Year | AY1 2020 |
AY2 2021 |
AY3 2022 |
AY4 2023 |
AY5 2024 |
FY1 2025 |
FY2 2026 |
FY3 2027 |
FY4 2028 |
FY5 2029 |
|---|---|---|---|---|---|---|---|---|---|---|
| Revenue | 12,179.8 | 9,431.9 | 11,321.0 | 12,702.2 | 14,167.1 | 16,081.7 | 18,255.1 | 20,722.3 | 23,522.8 | 26,701.8 |
| Revenue Growth, % | 0 | -22.56 | 20.03 | 12.2 | 11.53 | 13.51 | 13.51 | 13.51 | 13.51 | 13.51 |
| EBITDA | 9,256.0 | 6,444.4 | 7,802.8 | 8,545.5 | 9,626.3 | 11,207.9 | 12,722.6 | 14,442.0 | 16,393.8 | 18,609.4 |
| EBITDA, % | 75.99 | 68.33 | 68.92 | 67.28 | 67.95 | 69.69 | 69.69 | 69.69 | 69.69 | 69.69 |
| Depreciation | 2,615.7 | 2,775.2 | 3,123.7 | 3,391.8 | 3,714.9 | 4,226.8 | 4,798.0 | 5,446.5 | 6,182.5 | 7,018.1 |
| Depreciation, % | 21.48 | 29.42 | 27.59 | 26.7 | 26.22 | 26.28 | 26.28 | 26.28 | 26.28 | 26.28 |
| EBIT | 6,640.3 | 3,669.1 | 4,679.1 | 5,153.7 | 5,911.4 | 6,981.1 | 7,924.6 | 8,995.6 | 10,211.3 | 11,591.3 |
| EBIT, % | 54.52 | 38.9 | 41.33 | 40.57 | 41.73 | 43.41 | 43.41 | 43.41 | 43.41 | 43.41 |
| Total Cash | 11,173.1 | 8,826.5 | 11,206.7 | 11,756.2 | 12,120.2 | 14,872.7 | 16,882.8 | 19,164.4 | 21,754.4 | 24,694.4 |
| Total Cash, percent | .0 | .0 | .0 | .0 | .0 | .0 | .0 | .0 | .0 | .0 |
| Account Receivables | 110.0 | 84.8 | .0 | 259.2 | 315.9 | 195.3 | 221.7 | 251.7 | 285.7 | 324.3 |
| Account Receivables, % | 0.90313 | 0.89908 | 0 | 2.04 | 2.23 | 1.21 | 1.21 | 1.21 | 1.21 | 1.21 |
| Inventories | 297.2 | 376.0 | -330.1 | .0 | .0 | 112.9 | 128.2 | 145.5 | 165.2 | 187.5 |
| Inventories, % | 2.44 | 3.99 | -2.92 | 0 | 0 | 0.70222 | 0.70222 | 0.70222 | 0.70222 | 0.70222 |
| Accounts Payable | 309.9 | 248.0 | 478.6 | 268.0 | 728.1 | 535.5 | 607.9 | 690.0 | 783.3 | 889.2 |
| Accounts Payable, % | 2.54 | 2.63 | 4.23 | 2.11 | 5.14 | 3.33 | 3.33 | 3.33 | 3.33 | 3.33 |
| Capital Expenditure | -8,138.1 | -13,264.4 | -25,174.3 | -12,923.4 | -35,294.2 | -15,014.4 | -17,043.6 | -19,347.0 | -21,961.7 | -24,929.7 |
| Capital Expenditure, % | -66.82 | -140.63 | -222.37 | -101.74 | -249.13 | -93.36 | -93.36 | -93.36 | -93.36 | -93.36 |
| Tax Rate, % | 0.0198242 | 0.0198242 | 0.0198242 | 0.0198242 | 0.0198242 | 0.0198242 | 0.0198242 | 0.0198242 | 0.0198242 | 0.0198242 |
| EBITAT | 6,638.3 | 3,666.1 | 4,673.4 | 5,150.2 | 5,910.2 | 6,976.6 | 7,919.5 | 8,989.8 | 10,204.7 | 11,583.9 |
| Depreciation | ||||||||||
| Changes in Account Receivables | ||||||||||
| Changes in Inventories | ||||||||||
| Changes in Accounts Payable | ||||||||||
| Capital Expenditure | ||||||||||
| UFCF | 1,018.6 | -6,938.6 | -16,355.6 | -5,181.4 | -25,265.7 | -3,995.9 | -4,295.4 | -4,875.9 | -5,534.8 | -6,282.8 |
| WACC, % | 4.22 | 4.22 | 4.22 | 4.22 | 4.22 | 4.22 | 4.22 | 4.22 | 4.22 | 4.22 |
| PV UFCF | ||||||||||
| SUM PV UFCF | -21,899.1 | |||||||||
| Long Term Growth Rate, % | 3.60 | |||||||||
| Free cash flow (T + 1) | -6,509 | |||||||||
| Terminal Value | -1,055,255 | |||||||||
| Present Terminal Value | -858,357 | |||||||||
| Enterprise Value | -880,257 | |||||||||
| Net Debt | 83,818 | |||||||||
| Equity Value | -964,075 | |||||||||
| Diluted Shares Outstanding, MM | 1 | |||||||||
| Equity Value Per Share | -1,781,668.31 |
What You Will Receive
- Customizable Excel Template: A fully editable Excel-based DCF Calculator featuring pre-loaded financial data for Hoshino Resorts REIT, Inc. (3287T).
- Real-Time Data: Access to historical financials and forward-looking estimates (highlighted in the yellow cells).
- Adjustable Forecasts: Modify key assumptions such as revenue growth, EBITDA percentage, and WACC.
- Instant Calculations: Quickly assess how your input variables affect the valuation of Hoshino Resorts REIT, Inc. (3287T).
- Professional Resource: Designed for investors, CFOs, consultants, and financial analysts.
- User-Friendly Layout: Organized for easy navigation and comprehension, complete with step-by-step guidance.
Key Features of Hoshino Resorts REIT, Inc. (3287T)
- Accurate Financial Data: Gain access to reliable pre-loaded historical information and future forecasts.
- Tailored Forecast Parameters: Modify the yellow-highlighted cells for metrics like WACC, growth rates, and profit margins.
- Automated Financial Calculations: Real-time updates for DCF, Net Present Value (NPV), and cash flow assessments.
- Interactive Dashboard: User-friendly visuals and summaries for a clear representation of your valuation outcomes.
- Designed for All Skill Levels: An easy-to-navigate format suitable for investors, CFOs, and financial consultants alike.
How It Functions
- Download the Template: Gain immediate access to the Excel-based Hoshino Resorts REIT DCF Calculator.
- Input Your Assumptions: Modify the yellow-highlighted cells for growth rates, WACC, margins, and other variables.
- Instant Calculations: The model will automatically refresh and display Hoshino Resorts’ intrinsic value.
- Test Scenarios: Experiment with different assumptions to assess potential changes in valuation.
- Analyze and Decide: Leverage the results to inform your investment strategies or financial evaluations.
Why Choose This Calculator for Hoshino Resorts REIT, Inc. (3287T)?
- Designed for Industry Experts: A sophisticated tool utilized by analysts, investors, and financial advisors.
- Comprehensive Data: Includes Hoshino Resorts’ historical and forecasted financials for reliable insights.
- Flexible Scenario Analysis: Easily test various forecasts and assumptions to model different outcomes.
- Intuitive Outputs: Automatically calculates intrinsic value, NPV, and other essential metrics.
- User-Friendly: Step-by-step instructions make the calculation process straightforward.
Who Can Benefit from Hoshino Resorts REIT, Inc. (3287T)?
- Individual Investors: Gain insights to make wise choices regarding Hoshino Resorts REIT, Inc. (3287T) transactions.
- Financial Analysts: Enhance valuation tasks with comprehensive financial models tailored for Hoshino Resorts REIT, Inc. (3287T).
- Consultants: Provide timely and accurate valuation advice to clients based on Hoshino Resorts REIT, Inc. (3287T).
- Property Managers: Learn how major real estate investment trusts like Hoshino Resorts REIT, Inc. (3287T) determine their market value to inform your own business strategies.
- Finance Students: Acquire practical valuation skills through analysis of real-life data and case studies of Hoshino Resorts REIT, Inc. (3287T).
Contents of the Template
- Pre-Filled Data: Incorporates Hoshino Resorts REIT, Inc.'s historical financial performance and projections.
- Discounted Cash Flow Model: An editable DCF valuation model featuring automatic calculations.
- Weighted Average Cost of Capital (WACC): A specific sheet designed for WACC calculations based on user-defined inputs.
- Key Financial Ratios: Evaluate Hoshino Resorts REIT, Inc.'s profitability, efficiency, and leverage.
- Customizable Inputs: Easily modify revenue growth, margins, and tax rates as needed.
- Clear Dashboard: Visual representations, including charts and tables, summarizing essential valuation outcomes.
Disclaimer
All information, articles, and product details provided on this website are for general informational and educational purposes only. We do not claim any ownership over, nor do we intend to infringe upon, any trademarks, copyrights, logos, brand names, or other intellectual property mentioned or depicted on this site. Such intellectual property remains the property of its respective owners, and any references here are made solely for identification or informational purposes, without implying any affiliation, endorsement, or partnership.
We make no representations or warranties, express or implied, regarding the accuracy, completeness, or suitability of any content or products presented. Nothing on this website should be construed as legal, tax, investment, financial, medical, or other professional advice. In addition, no part of this site—including articles or product references—constitutes a solicitation, recommendation, endorsement, advertisement, or offer to buy or sell any securities, franchises, or other financial instruments, particularly in jurisdictions where such activity would be unlawful.
All content is of a general nature and may not address the specific circumstances of any individual or entity. It is not a substitute for professional advice or services. Any actions you take based on the information provided here are strictly at your own risk. You accept full responsibility for any decisions or outcomes arising from your use of this website and agree to release us from any liability in connection with your use of, or reliance upon, the content or products found herein.