
|
Tokyu Fudosan Holdings Corporation (3289.T) Valation DCF |
Entièrement Modifiable: Adapté À Vos Besoins Dans Excel Ou Sheets
Conception Professionnelle: Modèles Fiables Et Conformes Aux Normes Du Secteur
Pré-Construits Pour Une Utilisation Rapide Et Efficace
Compatible MAC/PC, entièrement débloqué
Aucune Expertise N'Est Requise; Facile À Suivre
Tokyu Fudosan Holdings Corporation (3289.T) Bundle
Explorez les perspectives financières de Tokyu Fudosan Holdings Corporation (3289T) avec notre calculatrice DCF conviviale! Entrez vos projections pour la croissance, les marges bénéficiaires et les dépenses pour calculer la valeur intrinsèque de Tokyu Fudosan Holdings Corporation (3289T) et améliorez votre approche d'investissement.
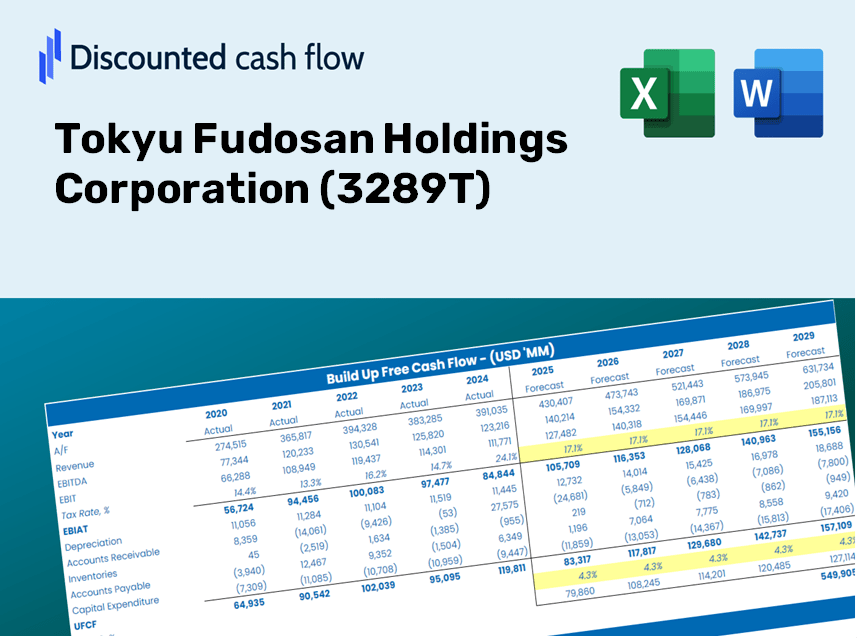
Discounted Cash Flow (DCF) - (USD MM)
| Year | AY1 2021 |
AY2 2022 |
AY3 2023 |
AY4 2024 |
AY5 2025 |
FY1 2026 |
FY2 2027 |
FY3 2028 |
FY4 2029 |
FY5 2030 |
|---|---|---|---|---|---|---|---|---|---|---|
| Revenue | 907,735.0 | 989,049.0 | 1,005,836.0 | 1,103,047.0 | 1,150,301.0 | 1,190,323.9 | 1,231,739.3 | 1,274,595.7 | 1,318,943.3 | 1,364,833.8 |
| Revenue Growth, % | 0 | 8.96 | 1.7 | 9.66 | 4.28 | 3.48 | 3.48 | 3.48 | 3.48 | 3.48 |
| EBITDA | 101,657.0 | 132,537.0 | 160,160.0 | 164,681.0 | 192,121.0 | 171,773.1 | 177,749.7 | 183,934.2 | 190,333.9 | 196,956.3 |
| EBITDA, % | 11.2 | 13.4 | 15.92 | 14.93 | 16.7 | 14.43 | 14.43 | 14.43 | 14.43 | 14.43 |
| Depreciation | 45,139.0 | 48,719.0 | 49,749.0 | 49,677.0 | 55,789.0 | 57,607.3 | 59,611.6 | 61,685.7 | 63,832.0 | 66,052.9 |
| Depreciation, % | 4.97 | 4.93 | 4.95 | 4.5 | 4.85 | 4.84 | 4.84 | 4.84 | 4.84 | 4.84 |
| EBIT | 56,518.0 | 83,818.0 | 110,411.0 | 115,004.0 | 136,332.0 | 114,165.9 | 118,138.1 | 122,248.5 | 126,501.9 | 130,903.4 |
| EBIT, % | 6.23 | 8.47 | 10.98 | 10.43 | 11.85 | 9.59 | 9.59 | 9.59 | 9.59 | 9.59 |
| Total Cash | 210,927.0 | 177,596.0 | 186,008.0 | 263,193.0 | 182,240.0 | 236,610.4 | 244,842.9 | 253,361.8 | 262,177.2 | 271,299.2 |
| Total Cash, percent | .0 | .0 | .0 | .0 | .0 | .0 | .0 | .0 | .0 | .0 |
| Account Receivables | 41,737.0 | 39,099.0 | 45,683.0 | 56,101.0 | 59,687.0 | 55,630.3 | 57,565.9 | 59,568.8 | 61,641.4 | 63,786.1 |
| Account Receivables, % | 4.6 | 3.95 | 4.54 | 5.09 | 5.19 | 4.67 | 4.67 | 4.67 | 4.67 | 4.67 |
| Inventories | 693,513.0 | 758,978.0 | 796,776.0 | 914,252.0 | 1,021,526.0 | 961,884.5 | 995,351.7 | 1,029,983.4 | 1,065,820.1 | 1,102,903.6 |
| Inventories, % | 76.4 | 76.74 | 79.22 | 82.88 | 88.81 | 80.81 | 80.81 | 80.81 | 80.81 | 80.81 |
| Accounts Payable | 56,714.0 | 43,900.0 | 41,847.0 | 69,633.0 | 52,852.0 | 61,311.9 | 63,445.2 | 65,652.6 | 67,936.9 | 70,300.7 |
| Accounts Payable, % | 6.25 | 4.44 | 4.16 | 6.31 | 4.59 | 5.15 | 5.15 | 5.15 | 5.15 | 5.15 |
| Capital Expenditure | -100,268.0 | -906.0 | -2,411.0 | -245,315.0 | -70,529.0 | -94,626.9 | -97,919.3 | -101,326.2 | -104,851.7 | -108,499.8 |
| Capital Expenditure, % | -11.05 | -0.09160315 | -0.2397 | -22.24 | -6.13 | -7.95 | -7.95 | -7.95 | -7.95 | -7.95 |
| Tax Rate, % | 36.6 | 36.6 | 36.6 | 36.6 | 36.6 | 36.6 | 36.6 | 36.6 | 36.6 | 36.6 |
| EBITAT | 29,269.4 | 52,703.9 | 75,904.7 | 76,543.1 | 86,439.8 | 71,553.5 | 74,043.0 | 76,619.2 | 79,285.1 | 82,043.7 |
| Depreciation | ||||||||||
| Changes in Account Receivables | ||||||||||
| Changes in Inventories | ||||||||||
| Changes in Accounts Payable | ||||||||||
| Capital Expenditure | ||||||||||
| UFCF | -704,395.6 | 24,875.9 | 76,807.7 | -219,202.9 | -55,941.2 | 106,691.9 | 2,465.8 | 2,551.6 | 2,640.4 | 2,732.3 |
| WACC, % | 2.86 | 3.13 | 3.27 | 3.22 | 3.14 | 3.13 | 3.13 | 3.13 | 3.13 | 3.13 |
| PV UFCF | ||||||||||
| SUM PV UFCF | 112,780.9 | |||||||||
| Long Term Growth Rate, % | 2.00 | |||||||||
| Free cash flow (T + 1) | 2,787 | |||||||||
| Terminal Value | 247,653 | |||||||||
| Present Terminal Value | 212,332 | |||||||||
| Enterprise Value | 325,113 | |||||||||
| Net Debt | 1,586,898 | |||||||||
| Equity Value | -1,261,785 | |||||||||
| Diluted Shares Outstanding, MM | 714 | |||||||||
| Equity Value Per Share | -1,768.11 |
What You Will Receive
- Pre-Populated Financial Model: Leverage Tokyu Fudosan Holdings Corporation's (3289T) actual data for an accurate DCF valuation.
- Comprehensive Forecast Control: Tailor revenue growth, profit margins, WACC, and other essential metrics.
- Immediate Calculations: Automatic updates provide real-time results as you modify inputs.
- Professional-Grade Template: A polished Excel file crafted for high-quality valuation presentations.
- Flexible and Reusable: Designed for adaptability, making it suitable for ongoing detailed forecasts.
Key Features of Tokyu Fudosan Holdings Corporation (3289T)
- Customizable Forecast Inputs: Adjust essential metrics such as revenue growth, EBITDA percentage, and capital expenditure plans.
- Instant DCF Valuation: Automatically computes intrinsic value, net present value (NPV), and additional financial metrics.
- High-Precision Results: Leverages Tokyu Fudosan's market data for accurate valuation assessments.
- Simplified Scenario Analysis: Effortlessly explore various assumptions and assess their impacts on outcomes.
- Efficiency-Boosting Solution: Skip the complexities of constructing detailed valuation models from the ground up.
How It Works
- Download the Template: Access the Excel-based DCF Calculator for Tokyu Fudosan Holdings Corporation (3289T) instantly.
- Input Your Assumptions: Modify the yellow-highlighted cells for parameters like growth rates, WACC, margins, and others.
- Instant Calculations: The model will automatically refresh Tokyu Fudosan's intrinsic value based on your inputs.
- Test Scenarios: Explore various assumptions to see how they affect valuation outcomes.
- Analyze and Decide: Utilize the results to inform your investment or financial analysis decisions.
Why Opt for the Tokyu Fudosan Holdings Calculator?
- Time-Efficient: No need to build a DCF model from the ground up – it's ready out of the box.
- Enhanced Accuracy: Dependable financial data and formulas minimize valuation errors.
- Completely Customizable: Adjust the model to align with your specific assumptions and forecasts.
- User-Friendly: Intuitive charts and outputs simplify result analysis.
- Endorsed by Professionals: Crafted for experts who prioritize both accuracy and ease of use.
Who Should Use This Product?
- Investors: Accurately assess the fair value of Tokyu Fudosan Holdings Corporation (3289T) before making investment choices.
- CFOs: Utilize a high-quality DCF model for effective financial reporting and analysis pertaining to Tokyu Fudosan Holdings Corporation (3289T).
- Consultants: Effortlessly tailor the template for valuation reports for clients interested in Tokyu Fudosan Holdings Corporation (3289T).
- Entrepreneurs: Acquire insights into the financial modeling techniques used by leading companies, including Tokyu Fudosan Holdings Corporation (3289T).
- Educators: Implement it as a valuable instructional resource to illustrate valuation methodologies relevant to Tokyu Fudosan Holdings Corporation (3289T).
Contents of the Template
- Comprehensive DCF Model: Editable template featuring detailed valuation calculations.
- Real-World Data: Tokyu Fudosan Holdings Corporation’s historical and projected financials preloaded for analysis.
- Customizable Parameters: Modify WACC, growth rates, and tax assumptions to explore various scenarios.
- Financial Statements: Complete annual and quarterly breakdowns for in-depth insights.
- Key Ratios: Integrated analysis for profitability, efficiency, and leverage metrics.
- Visual Dashboard: Charts and tables to present clear, actionable results.
Disclaimer
All information, articles, and product details provided on this website are for general informational and educational purposes only. We do not claim any ownership over, nor do we intend to infringe upon, any trademarks, copyrights, logos, brand names, or other intellectual property mentioned or depicted on this site. Such intellectual property remains the property of its respective owners, and any references here are made solely for identification or informational purposes, without implying any affiliation, endorsement, or partnership.
We make no representations or warranties, express or implied, regarding the accuracy, completeness, or suitability of any content or products presented. Nothing on this website should be construed as legal, tax, investment, financial, medical, or other professional advice. In addition, no part of this site—including articles or product references—constitutes a solicitation, recommendation, endorsement, advertisement, or offer to buy or sell any securities, franchises, or other financial instruments, particularly in jurisdictions where such activity would be unlawful.
All content is of a general nature and may not address the specific circumstances of any individual or entity. It is not a substitute for professional advice or services. Any actions you take based on the information provided here are strictly at your own risk. You accept full responsibility for any decisions or outcomes arising from your use of this website and agree to release us from any liability in connection with your use of, or reliance upon, the content or products found herein.