
|
Qinhuangdao Port Co., Ltd. (3369.hk) Évaluation DCF |
Entièrement Modifiable: Adapté À Vos Besoins Dans Excel Ou Sheets
Conception Professionnelle: Modèles Fiables Et Conformes Aux Normes Du Secteur
Pré-Construits Pour Une Utilisation Rapide Et Efficace
Compatible MAC/PC, entièrement débloqué
Aucune Expertise N'Est Requise; Facile À Suivre
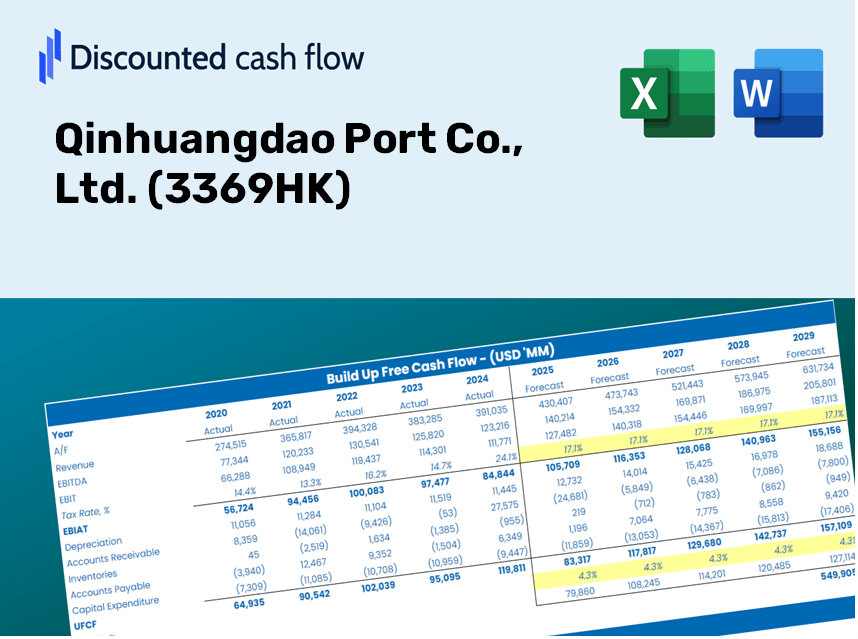
Qinhuangdao Port Co., Ltd. (3369.HK) Bundle
Évaluez Qinhuangdao Port Co., Ltd. Perspectives financières comme un expert! Cette calculatrice DCF (3369HK) fournit des données financières pré-remplies et offre une pleine flexibilité pour modifier la croissance des revenus, le WACC, les marges et d'autres hypothèses essentielles pour s'aligner sur vos projections.
Discounted Cash Flow (DCF) - (USD MM)
| Year | AY1 2020 |
AY2 2021 |
AY3 2022 |
AY4 2023 |
AY5 2024 |
FY1 2025 |
FY2 2026 |
FY3 2027 |
FY4 2028 |
FY5 2029 |
|---|---|---|---|---|---|---|---|---|---|---|
| Revenue | 7,073.4 | 7,225.7 | 7,581.3 | 7,729.7 | 7,522.1 | 7,641.4 | 7,762.6 | 7,885.8 | 8,010.9 | 8,138.0 |
| Revenue Growth, % | 0 | 2.15 | 4.92 | 1.96 | -2.69 | 1.59 | 1.59 | 1.59 | 1.59 | 1.59 |
| EBITDA | 3,053.0 | 3,079.7 | 3,203.8 | 3,794.9 | 3,171.1 | 3,351.4 | 3,404.6 | 3,458.6 | 3,513.5 | 3,569.2 |
| EBITDA, % | 43.16 | 42.62 | 42.26 | 49.09 | 42.16 | 43.86 | 43.86 | 43.86 | 43.86 | 43.86 |
| Depreciation | 1,365.1 | 1,361.1 | 1,332.3 | 1,472.7 | 1,374.3 | 1,421.8 | 1,444.4 | 1,467.3 | 1,490.6 | 1,514.2 |
| Depreciation, % | 19.3 | 18.84 | 17.57 | 19.05 | 18.27 | 18.61 | 18.61 | 18.61 | 18.61 | 18.61 |
| EBIT | 1,687.8 | 1,718.6 | 1,871.4 | 2,322.2 | 1,796.8 | 1,929.6 | 1,960.2 | 1,991.3 | 2,022.9 | 2,055.0 |
| EBIT, % | 23.86 | 23.79 | 24.68 | 30.04 | 23.89 | 25.25 | 25.25 | 25.25 | 25.25 | 25.25 |
| Total Cash | 3,894.8 | 4,439.3 | 5,311.4 | 3,109.5 | 4,690.2 | 4,418.9 | 4,489.0 | 4,560.2 | 4,632.6 | 4,706.1 |
| Total Cash, percent | .0 | .0 | .0 | .0 | .0 | .0 | .0 | .0 | .0 | .0 |
| Account Receivables | 237.6 | 197.5 | 161.7 | 69.6 | 204.0 | 180.9 | 183.8 | 186.7 | 189.6 | 192.6 |
| Account Receivables, % | 3.36 | 2.73 | 2.13 | 0.89995 | 2.71 | 2.37 | 2.37 | 2.37 | 2.37 | 2.37 |
| Inventories | 178.4 | 183.3 | 137.3 | 159.7 | 153.9 | 167.8 | 170.5 | 173.2 | 176.0 | 178.7 |
| Inventories, % | 2.52 | 2.54 | 1.81 | 2.07 | 2.05 | 2.2 | 2.2 | 2.2 | 2.2 | 2.2 |
| Accounts Payable | 206.5 | 261.5 | 284.8 | 277.7 | 355.2 | 284.4 | 288.9 | 293.5 | 298.2 | 302.9 |
| Accounts Payable, % | 2.92 | 3.62 | 3.76 | 3.59 | 4.72 | 3.72 | 3.72 | 3.72 | 3.72 | 3.72 |
| Capital Expenditure | -1,325.5 | -1,454.3 | -777.9 | -1,162.5 | -1,149.3 | -1,214.1 | -1,233.4 | -1,253.0 | -1,272.9 | -1,293.1 |
| Capital Expenditure, % | -18.74 | -20.13 | -10.26 | -15.04 | -15.28 | -15.89 | -15.89 | -15.89 | -15.89 | -15.89 |
| Tax Rate, % | 17.65 | 17.65 | 17.65 | 17.65 | 17.65 | 17.65 | 17.65 | 17.65 | 17.65 | 17.65 |
| EBITAT | 1,361.3 | 1,392.7 | 1,472.2 | 1,888.2 | 1,479.7 | 1,559.2 | 1,584.0 | 1,609.1 | 1,634.6 | 1,660.5 |
| Depreciation | ||||||||||
| Changes in Account Receivables | ||||||||||
| Changes in Inventories | ||||||||||
| Changes in Accounts Payable | ||||||||||
| Capital Expenditure | ||||||||||
| UFCF | 1,191.4 | 1,389.6 | 2,131.9 | 2,260.9 | 1,653.6 | 1,705.2 | 1,793.9 | 1,822.3 | 1,851.2 | 1,880.6 |
| WACC, % | 5.18 | 5.19 | 5.16 | 5.19 | 5.2 | 5.18 | 5.18 | 5.18 | 5.18 | 5.18 |
| PV UFCF | ||||||||||
| SUM PV UFCF | 7,781.5 | |||||||||
| Long Term Growth Rate, % | 2.00 | |||||||||
| Free cash flow (T + 1) | 1,918 | |||||||||
| Terminal Value | 60,239 | |||||||||
| Present Terminal Value | 46,786 | |||||||||
| Enterprise Value | 54,568 | |||||||||
| Net Debt | 1,003 | |||||||||
| Equity Value | 53,565 | |||||||||
| Diluted Shares Outstanding, MM | 5,587 | |||||||||
| Equity Value Per Share | 9.59 |
Benefits of Choosing Qinhuangdao Port Co., Ltd. (3369HK)
- Accurate 3369HK Financial Data: Equipped with historical and forecasted data for detailed analysis.
- Completely Customizable Template: Easily adjust critical inputs such as revenue growth, WACC, and EBITDA %.
- Real-Time Calculations: Instantly view updates to 3369HK's intrinsic value as you modify inputs.
- Expert Valuation Tool: Tailored for investors, analysts, and consultants aiming for precise DCF outcomes.
- Intuitive User Experience: Streamlined layout and straightforward guidance suitable for all skill levels.
Key Features
- Customizable Forecast Inputs: Adjust essential metrics such as cargo throughput, operating margins, and capital investments.
- Instant DCF Valuation: Quickly computes intrinsic value, NPV, and additional financial metrics.
- High-Precision Accuracy: Employs Qinhuangdao Port's actual financial data for dependable valuation results.
- Simplified Scenario Analysis: Evaluate various assumptions and analyze results effortlessly.
- Efficiency-Boosting Tool: Remove the hassle of constructing intricate valuation models from the ground up.
How It Functions
- Step 1: Download the Excel spreadsheet.
- Step 2: Examine the pre-filled data for Qinhuangdao Port Co., Ltd. (3369HK) (historical and projected).
- Step 3: Modify key assumptions (highlighted in yellow) according to your analysis.
- Step 4: Observe automatic recalculations for the intrinsic value of Qinhuangdao Port Co., Ltd. (3369HK).
- Step 5: Utilize the results for investment strategies or reporting purposes.
Why Opt for This Calculator?
- Precise Data: Authentic Qinhuangdao Port Co., Ltd. (3369HK) financials guarantee dependable valuation outcomes.
- Tailorable: Modify essential factors such as growth rates, WACC, and tax rates to align with your forecasts.
- Efficient: Built-in calculations save you the hassle of starting from the ground up.
- Professional Quality: Crafted for investors, analysts, and consultants seeking in-depth insights.
- Easy to Use: The intuitive design and guided instructions simplify the process for every user.
Who Can Benefit from Our Services?
- Finance Students: Master harbor logistics and operations management through practical case studies and data analysis.
- Researchers: Enhance your academic work with insights drawn from industry models and benchmarks.
- Investors: Evaluate your investment strategies by analyzing the performance and growth potential of Qinhuangdao Port Co., Ltd. (3369HK).
- Market Analysts: Improve your analytical process with our customizable tools designed for port industry assessments.
- Port Operators: Discover best practices from how leading companies, like Qinhuangdao Port Co., Ltd. (3369HK), manage their operations and finances.
Contents of the Template
- Pre-Filled Data: Features Qinhuangdao Port Co., Ltd.'s historical financial performance and forecasts.
- Discounted Cash Flow Model: An editable DCF valuation model that includes automatic calculations.
- Weighted Average Cost of Capital (WACC): A dedicated sheet for WACC calculation based on user-defined inputs.
- Key Financial Ratios: Evaluate Qinhuangdao Port Co., Ltd.'s profitability, efficiency, and leverage metrics.
- Customizable Inputs: Easily modify revenue growth, margins, and tax rates to fit your needs.
- Clear Dashboard: Visual representations and tables summarizing essential valuation outcomes.
Disclaimer
All information, articles, and product details provided on this website are for general informational and educational purposes only. We do not claim any ownership over, nor do we intend to infringe upon, any trademarks, copyrights, logos, brand names, or other intellectual property mentioned or depicted on this site. Such intellectual property remains the property of its respective owners, and any references here are made solely for identification or informational purposes, without implying any affiliation, endorsement, or partnership.
We make no representations or warranties, express or implied, regarding the accuracy, completeness, or suitability of any content or products presented. Nothing on this website should be construed as legal, tax, investment, financial, medical, or other professional advice. In addition, no part of this site—including articles or product references—constitutes a solicitation, recommendation, endorsement, advertisement, or offer to buy or sell any securities, franchises, or other financial instruments, particularly in jurisdictions where such activity would be unlawful.
All content is of a general nature and may not address the specific circumstances of any individual or entity. It is not a substitute for professional advice or services. Any actions you take based on the information provided here are strictly at your own risk. You accept full responsibility for any decisions or outcomes arising from your use of this website and agree to release us from any liability in connection with your use of, or reliance upon, the content or products found herein.