
|
Fuyao Glass Industry Group Co., Ltd. (3606.hk) Valation DCF |
Entièrement Modifiable: Adapté À Vos Besoins Dans Excel Ou Sheets
Conception Professionnelle: Modèles Fiables Et Conformes Aux Normes Du Secteur
Pré-Construits Pour Une Utilisation Rapide Et Efficace
Compatible MAC/PC, entièrement débloqué
Aucune Expertise N'Est Requise; Facile À Suivre
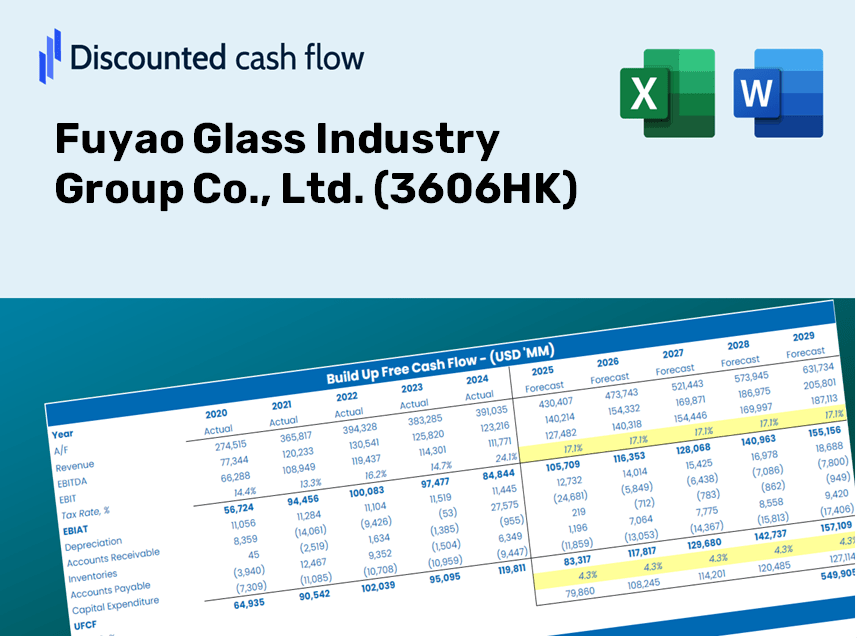
Fuyao Glass Industry Group Co., Ltd. (3606.HK) Bundle
En tant qu'investisseur ou analyste, la calculatrice DCF (3606HK) est votre ressource incontournable pour une évaluation précise. Chargé de données réelles de Fuyao Glass Industry Group Co., Ltd., vous pouvez ajuster les prévisions et observer les effets en temps réel.
Discounted Cash Flow (DCF) - (USD MM)
| Year | AY1 2020 |
AY2 2021 |
AY3 2022 |
AY4 2023 |
AY5 2024 |
FY1 2025 |
FY2 2026 |
FY3 2027 |
FY4 2028 |
FY5 2029 |
|---|---|---|---|---|---|---|---|---|---|---|
| Revenue | 21,765.8 | 25,807.5 | 30,723.1 | 36,258.2 | 42,917.7 | 50,857.3 | 60,265.8 | 71,414.8 | 84,626.4 | 100,282.1 |
| Revenue Growth, % | 0 | 18.57 | 19.05 | 18.02 | 18.37 | 18.5 | 18.5 | 18.5 | 18.5 | 18.5 |
| EBITDA | 5,574.1 | 6,379.9 | 8,384.9 | 9,754.5 | 12,407.9 | 13,572.4 | 16,083.3 | 19,058.7 | 22,584.5 | 26,762.5 |
| EBITDA, % | 25.61 | 24.72 | 27.29 | 26.9 | 28.91 | 26.69 | 26.69 | 26.69 | 26.69 | 26.69 |
| Depreciation | 2,173.1 | 2,197.4 | 2,280.6 | 2,430.9 | 2,615.7 | 3,938.5 | 4,667.1 | 5,530.5 | 6,553.6 | 7,766.0 |
| Depreciation, % | 9.98 | 8.51 | 7.42 | 6.7 | 6.09 | 7.74 | 7.74 | 7.74 | 7.74 | 7.74 |
| EBIT | 3,401.0 | 4,182.5 | 6,104.3 | 7,323.6 | 9,792.2 | 9,634.0 | 11,416.2 | 13,528.2 | 16,030.9 | 18,996.5 |
| EBIT, % | 15.63 | 16.21 | 19.87 | 20.2 | 22.82 | 18.94 | 18.94 | 18.94 | 18.94 | 18.94 |
| Total Cash | 9,961.2 | 15,672.4 | 18,617.3 | 20,254.0 | 20,547.4 | 27,547.1 | 32,643.2 | 38,682.2 | 45,838.3 | 54,318.2 |
| Total Cash, percent | .0 | .0 | .0 | .0 | .0 | .0 | .0 | .0 | .0 | .0 |
| Account Receivables | 6,103.4 | 6,150.2 | 7,367.5 | 9,633.8 | 12,046.0 | 13,272.8 | 15,728.2 | 18,637.9 | 22,085.9 | 26,171.7 |
| Account Receivables, % | 28.04 | 23.83 | 23.98 | 26.57 | 28.07 | 26.1 | 26.1 | 26.1 | 26.1 | 26.1 |
| Inventories | 3,587.4 | 4,731.2 | 5,908.0 | 5,624.0 | 6,528.3 | 8,622.0 | 10,217.1 | 12,107.2 | 14,347.0 | 17,001.1 |
| Inventories, % | 16.48 | 18.33 | 19.23 | 15.51 | 15.21 | 16.95 | 16.95 | 16.95 | 16.95 | 16.95 |
| Accounts Payable | 2,696.3 | 3,442.3 | 4,541.7 | 6,038.8 | 6,345.1 | 7,318.2 | 8,672.0 | 10,276.3 | 12,177.4 | 14,430.2 |
| Accounts Payable, % | 12.39 | 13.34 | 14.78 | 16.66 | 14.78 | 14.39 | 14.39 | 14.39 | 14.39 | 14.39 |
| Capital Expenditure | -1,938.1 | -2,546.0 | -3,422.6 | -4,892.6 | -5,992.8 | -5,835.1 | -6,914.6 | -8,193.7 | -9,709.5 | -11,505.8 |
| Capital Expenditure, % | -8.9 | -9.87 | -11.14 | -13.49 | -13.96 | -11.47 | -11.47 | -11.47 | -11.47 | -11.47 |
| Tax Rate, % | 16.6 | 16.6 | 16.6 | 16.6 | 16.6 | 16.6 | 16.6 | 16.6 | 16.6 | 16.6 |
| EBITAT | 2,844.5 | 3,445.8 | 5,203.3 | 6,138.5 | 8,166.3 | 8,063.2 | 9,554.8 | 11,322.4 | 13,417.1 | 15,899.2 |
| Depreciation | ||||||||||
| Changes in Account Receivables | ||||||||||
| Changes in Inventories | ||||||||||
| Changes in Accounts Payable | ||||||||||
| Capital Expenditure | ||||||||||
| UFCF | -3,915.0 | 2,652.5 | 2,766.5 | 3,191.7 | 1,779.1 | 3,819.1 | 4,610.7 | 5,463.7 | 6,474.5 | 7,672.2 |
| WACC, % | 8.22 | 8.22 | 8.23 | 8.22 | 8.22 | 8.22 | 8.22 | 8.22 | 8.22 | 8.22 |
| PV UFCF | ||||||||||
| SUM PV UFCF | 21,663.6 | |||||||||
| Long Term Growth Rate, % | 2.00 | |||||||||
| Free cash flow (T + 1) | 7,826 | |||||||||
| Terminal Value | 125,745 | |||||||||
| Present Terminal Value | 84,700 | |||||||||
| Enterprise Value | 106,364 | |||||||||
| Net Debt | -7,259 | |||||||||
| Equity Value | 113,623 | |||||||||
| Diluted Shares Outstanding, MM | 2,603 | |||||||||
| Equity Value Per Share | 43.65 |
Benefits You Will Receive
- Adjustable Forecast Parameters: Effortlessly modify assumptions (growth %, profit margins, WACC) to explore various scenarios.
- Comprehensive Financial Data: Fuyao Glass Industry Group’s [3606HK] financial information pre-loaded to facilitate your analysis.
- Automated DCF Calculations: The template computes Net Present Value (NPV) and intrinsic value automatically.
- Professional and Customizable Design: A refined Excel model tailored to meet your valuation requirements.
- Designed for Analysts and Investors: Perfect for evaluating projections, confirming strategies, and maximizing efficiency.
Key Features
- Real-Life 3606HK Data: Comprehensive access to Fuyao Glass's historical financial performance and future projections.
- Fully Customizable Inputs: Tailor revenue growth, profit margins, WACC, tax rates, and capital expenditures to suit your analysis.
- Dynamic Valuation Model: Instantaneous updates to Net Present Value (NPV) and intrinsic value based on your customized inputs.
- Scenario Testing: Generate various forecasting scenarios to evaluate different valuation results.
- User-Friendly Design: Intuitive layout crafted for both professionals and novices.
How It Operates
- 1. Access the Template: Download and open the Excel file containing Fuyao Glass Industry Group Co., Ltd.'s preloaded data.
- 2. Modify Assumptions: Update key parameters such as growth rates, WACC, and capital expenditures.
- 3. Instant Results: The DCF model automatically computes intrinsic value and NPV in real-time.
- 4. Explore Scenarios: Evaluate various forecasts to understand different valuation outcomes.
- 5. Present with Assurance: Deliver expert valuation insights to aid your decision-making process.
Why Choose This Calculator for Fuyao Glass Industry Group Co., Ltd. (3606HK)?
- Precise Financial Data: Utilize authentic financials from Fuyao for dependable valuation outcomes.
- Fully Customizable: Modify essential variables like growth rates, WACC, and tax rates to align with your forecasts.
- Efficiency Boost: Pre-configured calculations save you the time of starting from the ground up.
- Professional-Quality Tool: Tailored for investors, analysts, and industry consultants.
- Easy to Use: A user-friendly design with clear instructions makes it accessible for everyone.
Who Should Use This Product?
- Individual Investors: Make informed decisions about buying or selling Fuyao Glass Industry Group Co., Ltd. (3606HK) stock.
- Financial Analysts: Enhance valuation processes with comprehensive financial models tailored for Fuyao Glass Industry Group Co., Ltd. (3606HK).
- Consultants: Provide clients with accurate and timely valuation insights regarding Fuyao Glass Industry Group Co., Ltd. (3606HK).
- Business Owners: Gain insights into the valuation of large companies like Fuyao Glass Industry Group Co., Ltd. (3606HK) to inform your own business strategies.
- Finance Students: Explore valuation methodologies using real-world data and case studies from Fuyao Glass Industry Group Co., Ltd. (3606HK).
Contents of the Template
- Comprehensive DCF Model: An editable template featuring detailed valuation calculations.
- Real-World Data: Fuyao Glass Industry Group Co., Ltd. (3606HK)’s historical and projected financials preloaded for thorough analysis.
- Customizable Parameters: Tailor WACC, growth rates, and tax assumptions to explore different scenarios.
- Financial Statements: Complete annual and quarterly breakdowns for enhanced insights.
- Key Ratios: Integrated analysis for profitability, efficiency, and leverage metrics.
- Dashboard with Visual Outputs: Visualizations including charts and tables for clear, actionable findings.
Disclaimer
All information, articles, and product details provided on this website are for general informational and educational purposes only. We do not claim any ownership over, nor do we intend to infringe upon, any trademarks, copyrights, logos, brand names, or other intellectual property mentioned or depicted on this site. Such intellectual property remains the property of its respective owners, and any references here are made solely for identification or informational purposes, without implying any affiliation, endorsement, or partnership.
We make no representations or warranties, express or implied, regarding the accuracy, completeness, or suitability of any content or products presented. Nothing on this website should be construed as legal, tax, investment, financial, medical, or other professional advice. In addition, no part of this site—including articles or product references—constitutes a solicitation, recommendation, endorsement, advertisement, or offer to buy or sell any securities, franchises, or other financial instruments, particularly in jurisdictions where such activity would be unlawful.
All content is of a general nature and may not address the specific circumstances of any individual or entity. It is not a substitute for professional advice or services. Any actions you take based on the information provided here are strictly at your own risk. You accept full responsibility for any decisions or outcomes arising from your use of this website and agree to release us from any liability in connection with your use of, or reliance upon, the content or products found herein.