
|
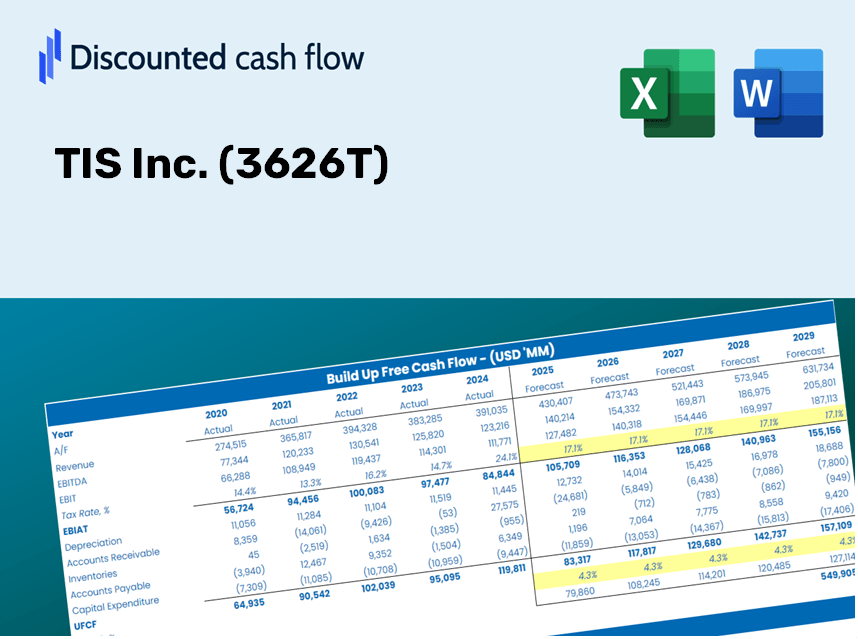
Tis Inc. (3626.T) Évaluation DCF |
Entièrement Modifiable: Adapté À Vos Besoins Dans Excel Ou Sheets
Conception Professionnelle: Modèles Fiables Et Conformes Aux Normes Du Secteur
Pré-Construits Pour Une Utilisation Rapide Et Efficace
Compatible MAC/PC, entièrement débloqué
Aucune Expertise N'Est Requise; Facile À Suivre
TIS Inc. (3626.T) Bundle
Conçu pour la précision, notre (3626t) calculatrice DCF vous permet d'évaluer l'évaluation de Tis Inc. à l'aide de données financières du monde réel et permet une flexibilité complète pour modifier tous les paramètres clés pour des projections améliorées.
Discounted Cash Flow (DCF) - (USD MM)
| Year | AY1 2021 |
AY2 2022 |
AY3 2023 |
AY4 2024 |
AY5 2025 |
FY1 2026 |
FY2 2027 |
FY3 2028 |
FY4 2029 |
FY5 2030 |
|---|---|---|---|---|---|---|---|---|---|---|
| Revenue | 448,383.0 | 482,547.0 | 508,400.0 | 549,004.0 | 571,687.0 | 607,553.6 | 645,670.4 | 686,178.6 | 729,228.2 | 774,978.7 |
| Revenue Growth, % | 0 | 7.62 | 5.36 | 7.99 | 4.13 | 6.27 | 6.27 | 6.27 | 6.27 | 6.27 |
| EBITDA | 58,587.0 | 77,775.0 | 97,584.0 | 87,755.0 | 94,302.0 | 98,251.2 | 104,415.3 | 110,966.1 | 117,927.9 | 125,326.5 |
| EBITDA, % | 13.07 | 16.12 | 19.19 | 15.98 | 16.5 | 16.17 | 16.17 | 16.17 | 16.17 | 16.17 |
| Depreciation | 13,544.0 | 15,972.0 | 15,857.0 | 17,959.0 | 19,566.0 | 19,615.8 | 20,846.5 | 22,154.3 | 23,544.3 | 25,021.4 |
| Depreciation, % | 3.02 | 3.31 | 3.12 | 3.27 | 3.42 | 3.23 | 3.23 | 3.23 | 3.23 | 3.23 |
| EBIT | 45,043.0 | 61,803.0 | 81,727.0 | 69,796.0 | 74,736.0 | 78,635.4 | 83,568.8 | 88,811.7 | 94,383.6 | 100,305.1 |
| EBIT, % | 10.05 | 12.81 | 16.08 | 12.71 | 13.07 | 12.94 | 12.94 | 12.94 | 12.94 | 12.94 |
| Total Cash | 83,604.0 | 114,492.0 | 94,959.0 | 103,835.0 | 122,730.0 | 123,250.3 | 130,982.8 | 139,200.5 | 147,933.7 | 157,214.8 |
| Total Cash, percent | .0 | .0 | .0 | .0 | .0 | .0 | .0 | .0 | .0 | .0 |
| Account Receivables | 115,707.0 | 115,067.0 | 135,569.0 | 148,061.0 | 155,217.0 | 158,494.6 | 168,438.2 | 179,005.7 | 190,236.2 | 202,171.3 |
| Account Receivables, % | 25.81 | 23.85 | 26.67 | 26.97 | 27.15 | 26.09 | 26.09 | 26.09 | 26.09 | 26.09 |
| Inventories | 6,186.0 | 3,031.0 | 5,483.0 | 5,571.0 | 6,482.0 | 6,360.9 | 6,759.9 | 7,184.0 | 7,634.7 | 8,113.7 |
| Inventories, % | 1.38 | 0.62813 | 1.08 | 1.01 | 1.13 | 1.05 | 1.05 | 1.05 | 1.05 | 1.05 |
| Accounts Payable | 26,467.0 | 22,475.0 | 26,976.0 | 26,206.0 | 28,946.0 | 31,231.9 | 33,191.4 | 35,273.7 | 37,486.8 | 39,838.6 |
| Accounts Payable, % | 5.9 | 4.66 | 5.31 | 4.77 | 5.06 | 5.14 | 5.14 | 5.14 | 5.14 | 5.14 |
| Capital Expenditure | -21,523.0 | -15,279.0 | -10,382.0 | -18,931.0 | -18,819.0 | -20,351.4 | -21,628.2 | -22,985.1 | -24,427.2 | -25,959.7 |
| Capital Expenditure, % | -4.8 | -3.17 | -2.04 | -3.45 | -3.29 | -3.35 | -3.35 | -3.35 | -3.35 | -3.35 |
| Tax Rate, % | 32.55 | 32.55 | 32.55 | 32.55 | 32.55 | 32.55 | 32.55 | 32.55 | 32.55 | 32.55 |
| EBITAT | 27,832.3 | 39,668.7 | 55,620.9 | 49,298.9 | 50,409.3 | 52,232.1 | 55,509.0 | 58,991.6 | 62,692.6 | 66,625.8 |
| Depreciation | ||||||||||
| Changes in Account Receivables | ||||||||||
| Changes in Inventories | ||||||||||
| Changes in Accounts Payable | ||||||||||
| Capital Expenditure | ||||||||||
| UFCF | -75,572.7 | 40,164.7 | 42,642.9 | 34,976.9 | 45,829.3 | 50,626.0 | 46,344.0 | 49,251.5 | 52,341.5 | 55,625.3 |
| WACC, % | 4.58 | 4.59 | 4.59 | 4.59 | 4.59 | 4.59 | 4.59 | 4.59 | 4.59 | 4.59 |
| PV UFCF | ||||||||||
| SUM PV UFCF | 222,015.3 | |||||||||
| Long Term Growth Rate, % | 2.00 | |||||||||
| Free cash flow (T + 1) | 56,738 | |||||||||
| Terminal Value | 2,192,295 | |||||||||
| Present Terminal Value | 1,751,816 | |||||||||
| Enterprise Value | 1,973,832 | |||||||||
| Net Debt | -42,941 | |||||||||
| Equity Value | 2,016,773 | |||||||||
| Diluted Shares Outstanding, MM | 233 | |||||||||
| Equity Value Per Share | 8,669.78 |
Benefits of Choosing TIS Inc. (3626T)
- Comprehensive Financial Model: Leverage TIS Inc.'s actual data for an accurate DCF valuation.
- Complete Forecast Customization: Modify revenue growth, profit margins, WACC, and other essential factors.
- Real-Time Calculations: Automatic updates provide immediate feedback as adjustments are made.
- Professional-Grade Template: A polished Excel file crafted for serious valuation needs.
- Flexible and Reusable: Designed for adaptability, making it suitable for detailed forecasts time and again.
Key Features
- 🔍 Real-Life TIS Inc. Financials: Pre-filled historical and projected data for TIS Inc. (3626T).
- ✏️ Fully Customizable Inputs: Adjust all essential parameters (yellow cells) such as WACC, growth %, and tax rates.
- 📊 Professional DCF Valuation: Integrated formulas to determine TIS Inc.'s intrinsic value using the Discounted Cash Flow method.
- ⚡ Instant Results: See TIS Inc.’s valuation immediately after modifications.
- Scenario Analysis: Analyze and compare outcomes for different financial assumptions side-by-side.
How It Operates
- 1. Access the Template: Download and open the Excel file containing TIS Inc.'s (3626T) preloaded data.
- 2. Modify Assumptions: Adjust key variables such as growth rates, WACC, and capital expenditures.
- 3. Observe Instant Results: The DCF model automatically computes intrinsic value and NPV.
- 4. Evaluate Scenarios: Analyze various forecasts to assess different valuation outcomes.
- 5. Utilize with Assurance: Deliver professional valuation insights to underpin your decision-making.
Why Opt for the TIS Inc. Calculator?
- Time Efficiency: No need to build a DCF model from scratch – it's readily available for use.
- Enhanced Accuracy: Dependable financial data and formulas minimize valuation errors.
- Completely Customizable: Adjust the model to fit your specific assumptions and projections.
- User-Friendly: Intuitive charts and outputs simplify result analysis.
- Endorsed by Professionals: Crafted for experts who prioritize precision and functionality.
Who Can Benefit from TIS Inc. (3626T)?
- Institutional Investors: Develop comprehensive and reliable valuation models for investment assessments.
- Corporate Financial Teams: Evaluate valuation scenarios to inform strategic planning.
- Consultants and Financial Advisors: Deliver precise valuation insights for TIS Inc. (3626T) to clients.
- Students and Educators: Leverage real-time data to practice and teach financial modeling techniques.
- Technology Aficionados: Gain insights into how technology companies like TIS Inc. (3626T) are valued in the marketplace.
What the Template Includes
- Preloaded TIS Inc. Data: Historical and forecasted financial information, including revenue, EBIT, and capital expenditures.
- DCF and WACC Models: Advanced spreadsheets for calculating intrinsic value and Weighted Average Cost of Capital.
- Editable Inputs: Yellow-highlighted cells for modifying revenue growth, tax rates, and discount rates.
- Financial Statements: Detailed annual and quarterly financials for extensive analysis.
- Key Ratios: Ratios for profitability, leverage, and efficiency to assess performance.
- Dashboard and Charts: Graphical summaries of valuation results and underlying assumptions.
Disclaimer
All information, articles, and product details provided on this website are for general informational and educational purposes only. We do not claim any ownership over, nor do we intend to infringe upon, any trademarks, copyrights, logos, brand names, or other intellectual property mentioned or depicted on this site. Such intellectual property remains the property of its respective owners, and any references here are made solely for identification or informational purposes, without implying any affiliation, endorsement, or partnership.
We make no representations or warranties, express or implied, regarding the accuracy, completeness, or suitability of any content or products presented. Nothing on this website should be construed as legal, tax, investment, financial, medical, or other professional advice. In addition, no part of this site—including articles or product references—constitutes a solicitation, recommendation, endorsement, advertisement, or offer to buy or sell any securities, franchises, or other financial instruments, particularly in jurisdictions where such activity would be unlawful.
All content is of a general nature and may not address the specific circumstances of any individual or entity. It is not a substitute for professional advice or services. Any actions you take based on the information provided here are strictly at your own risk. You accept full responsibility for any decisions or outcomes arising from your use of this website and agree to release us from any liability in connection with your use of, or reliance upon, the content or products found herein.