
|
Yancoal Australia Ltd (3668.HK) Valation DCF |
Entièrement Modifiable: Adapté À Vos Besoins Dans Excel Ou Sheets
Conception Professionnelle: Modèles Fiables Et Conformes Aux Normes Du Secteur
Pré-Construits Pour Une Utilisation Rapide Et Efficace
Compatible MAC/PC, entièrement débloqué
Aucune Expertise N'Est Requise; Facile À Suivre
Yancoal Australia Ltd (3668.HK) Bundle
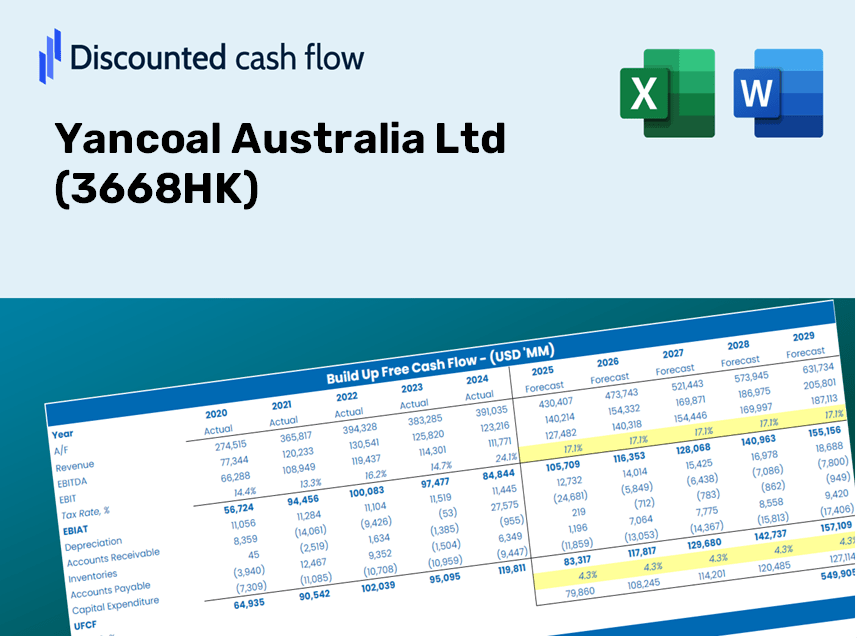
Découvrez la vraie valeur de Yancoal Australia Ltd (3668HK) avec notre calculatrice avancée DCF! Ajustez les hypothèses clés, explorez divers scénarios et évaluez comment les changements affectent l'évaluation de Yancoal Australia Ltd (3668HK) - le tout dans un modèle Excel pratique.
Discounted Cash Flow (DCF) - (USD MM)
| Year | AY1 2020 |
AY2 2021 |
AY3 2022 |
AY4 2023 |
AY5 2024 |
FY1 2025 |
FY2 2026 |
FY3 2027 |
FY4 2028 |
FY5 2029 |
|---|---|---|---|---|---|---|---|---|---|---|
| Revenue | 17,659.0 | 27,497.8 | 53,694.0 | 39,680.7 | 34,402.8 | 43,999.7 | 56,273.7 | 71,971.5 | 92,048.4 | 117,725.9 |
| Revenue Growth, % | 0 | 55.72 | 95.27 | -26.1 | -13.3 | 27.9 | 27.9 | 27.9 | 27.9 | 27.9 |
| EBITDA | 2,923.7 | 10,886.3 | 32,430.0 | 17,831.9 | 12,559.1 | 17,422.8 | 22,283.0 | 28,499.0 | 36,449.0 | 46,616.6 |
| EBITDA, % | 16.56 | 39.59 | 60.4 | 44.94 | 36.51 | 39.6 | 39.6 | 39.6 | 39.6 | 39.6 |
| Depreciation | 3,884.7 | 4,525.3 | 4,255.9 | 4,479.6 | 3,813.5 | 6,050.4 | 7,738.2 | 9,896.9 | 12,657.7 | 16,188.6 |
| Depreciation, % | 22 | 16.46 | 7.93 | 11.29 | 11.08 | 13.75 | 13.75 | 13.75 | 13.75 | 13.75 |
| EBIT | -961.0 | 6,360.9 | 28,174.1 | 13,352.3 | 8,745.6 | 11,372.4 | 14,544.8 | 18,602.1 | 23,791.3 | 30,428.1 |
| EBIT, % | -5.44 | 23.13 | 52.47 | 33.65 | 25.42 | 25.85 | 25.85 | 25.85 | 25.85 | 25.85 |
| Total Cash | 3,238.9 | 7,601.6 | 13,723.5 | 7,103.3 | 12,513.3 | 11,072.0 | 14,160.5 | 18,110.7 | 23,162.8 | 29,624.2 |
| Total Cash, percent | .0 | .0 | .0 | .0 | .0 | .0 | .0 | .0 | .0 | .0 |
| Account Receivables | 1,545.7 | 3,711.8 | 3,844.0 | 3,366.0 | 3,050.8 | 4,115.0 | 5,262.9 | 6,731.0 | 8,608.7 | 11,010.1 |
| Account Receivables, % | 8.75 | 13.5 | 7.16 | 8.48 | 8.87 | 9.35 | 9.35 | 9.35 | 9.35 | 9.35 |
| Inventories | 1,586.4 | 1,342.4 | 1,677.9 | 2,115.2 | 2,130.5 | 2,509.2 | 3,209.1 | 4,104.3 | 5,249.3 | 6,713.6 |
| Inventories, % | 8.98 | 4.88 | 3.13 | 5.33 | 6.19 | 5.7 | 5.7 | 5.7 | 5.7 | 5.7 |
| Accounts Payable | 2,105.0 | 2,328.8 | 3,401.6 | 2,761.0 | 3,915.2 | 3,965.5 | 5,071.7 | 6,486.5 | 8,296.0 | 10,610.2 |
| Accounts Payable, % | 11.92 | 8.47 | 6.34 | 6.96 | 11.38 | 9.01 | 9.01 | 9.01 | 9.01 | 9.01 |
| Capital Expenditure | -1,418.6 | -1,367.8 | -2,796.6 | -3,162.7 | -3,584.7 | -3,221.3 | -4,119.9 | -5,269.2 | -6,739.0 | -8,618.9 |
| Capital Expenditure, % | -8.03 | -4.97 | -5.21 | -7.97 | -10.42 | -7.32 | -7.32 | -7.32 | -7.32 | -7.32 |
| Tax Rate, % | 28 | 28 | 28 | 28 | 28 | 28 | 28 | 28 | 28 | 28 |
| EBITAT | -874.4 | 4,561.6 | 19,845.3 | 9,403.0 | 6,296.4 | 8,542.0 | 10,924.8 | 13,972.3 | 17,870.0 | 22,855.0 |
| Depreciation | ||||||||||
| Changes in Account Receivables | ||||||||||
| Changes in Inventories | ||||||||||
| Changes in Accounts Payable | ||||||||||
| Capital Expenditure | ||||||||||
| UFCF | 564.6 | 6,020.9 | 21,909.7 | 10,119.9 | 7,979.5 | 9,978.6 | 13,801.5 | 17,651.5 | 22,575.5 | 28,873.1 |
| WACC, % | 4.96 | 4.88 | 4.88 | 4.88 | 4.88 | 4.9 | 4.9 | 4.9 | 4.9 | 4.9 |
| PV UFCF | ||||||||||
| SUM PV UFCF | 78,727.9 | |||||||||
| Long Term Growth Rate, % | 2.00 | |||||||||
| Free cash flow (T + 1) | 29,451 | |||||||||
| Terminal Value | 1,016,466 | |||||||||
| Present Terminal Value | 800,332 | |||||||||
| Enterprise Value | 879,060 | |||||||||
| Net Debt | -11,944 | |||||||||
| Equity Value | 891,004 | |||||||||
| Diluted Shares Outstanding, MM | 1,322 | |||||||||
| Equity Value Per Share | 674.16 |
What You Will Receive
- Authentic Yancoal Financials: Access to historical and projected data for precise valuation.
- Customizable Inputs: Adjust WACC, tax rates, revenue growth, and capital expenditures as needed.
- Dynamic Calculations: Intrinsic value and NPV are computed in real-time.
- Scenario Analysis: Explore various scenarios to assess Yancoal's future performance.
- User-Friendly Design: Crafted for professionals but easy for beginners to navigate.
Key Features
- Customizable Forecast Inputs: Adjust essential factors such as production volume, commodity prices, and operational costs.
- Instant DCF Valuation: Automatically computes intrinsic value, NPV, and other key metrics with ease.
- Industry-Leading Precision: Incorporates Yancoal's actual financial data for reliable valuation results.
- Effortless Scenario Analysis: Easily test various scenarios and analyze results side by side.
- Efficiency Booster: Save time by avoiding the creation of intricate valuation models from the ground up.
How It Works for Yancoal Australia Ltd (3668HK)
- 1. Access the Template: Download and open the Excel file featuring Yancoal’s preloaded data.
- 2. Adjust Assumptions: Modify key inputs such as growth rates, WACC, and capital expenditures specific to Yancoal.
- 3. View Instant Results: The DCF model automatically computes intrinsic value and NPV based on your inputs.
- 4. Explore Scenarios: Analyze various forecasts to evaluate different valuation outcomes for Yancoal.
- 5. Present with Confidence: Deliver professional valuation analysis to enhance your decision-making for Yancoal Australia Ltd (3668HK).
Why Choose This Calculator for Yancoal Australia Ltd (3668HK)?
- All-in-One Solution: Incorporates DCF, WACC, and financial ratio assessments within a single tool.
- Tailored Inputs: Modify the yellow-highlighted fields to explore different scenarios.
- In-Depth Analysis: Automatically determines Yancoal’s intrinsic value and Net Present Value.
- Preloaded Information: Access to historical and projected data for precise calculations.
- Expert Quality: Perfect for financial analysts, investors, and business advisors.
Who Can Benefit from Yancoal Australia Ltd (3668HK)?
- Investors: Gain clarity in your investment choices with a sophisticated valuation instrument.
- Financial Analysts: Streamline your workflow with a customizable pre-built DCF model.
- Consultants: Effortlessly modify the template for impactful client presentations or reports.
- Finance Enthusiasts: Enhance your knowledge of valuation practices through real-world case studies.
- Educators and Students: Leverage this as a hands-on learning resource in finance-related programs.
Overview of the Template Contents
- Pre-Filled DCF Model: Yancoal Australia Ltd's financial data preloaded for immediate analysis.
- WACC Calculator: Comprehensive calculations for Weighted Average Cost of Capital.
- Financial Ratios: Assess Yancoal’s profitability, leverage, and operational efficiency.
- Editable Inputs: Modify assumptions regarding growth, margins, and capital expenditures to tailor to your specific scenarios.
- Financial Statements: Annual and quarterly reports to facilitate in-depth analysis.
- Interactive Dashboard: Effortlessly visualize essential valuation metrics and outcomes.
Disclaimer
All information, articles, and product details provided on this website are for general informational and educational purposes only. We do not claim any ownership over, nor do we intend to infringe upon, any trademarks, copyrights, logos, brand names, or other intellectual property mentioned or depicted on this site. Such intellectual property remains the property of its respective owners, and any references here are made solely for identification or informational purposes, without implying any affiliation, endorsement, or partnership.
We make no representations or warranties, express or implied, regarding the accuracy, completeness, or suitability of any content or products presented. Nothing on this website should be construed as legal, tax, investment, financial, medical, or other professional advice. In addition, no part of this site—including articles or product references—constitutes a solicitation, recommendation, endorsement, advertisement, or offer to buy or sell any securities, franchises, or other financial instruments, particularly in jurisdictions where such activity would be unlawful.
All content is of a general nature and may not address the specific circumstances of any individual or entity. It is not a substitute for professional advice or services. Any actions you take based on the information provided here are strictly at your own risk. You accept full responsibility for any decisions or outcomes arising from your use of this website and agree to release us from any liability in connection with your use of, or reliance upon, the content or products found herein.