
|
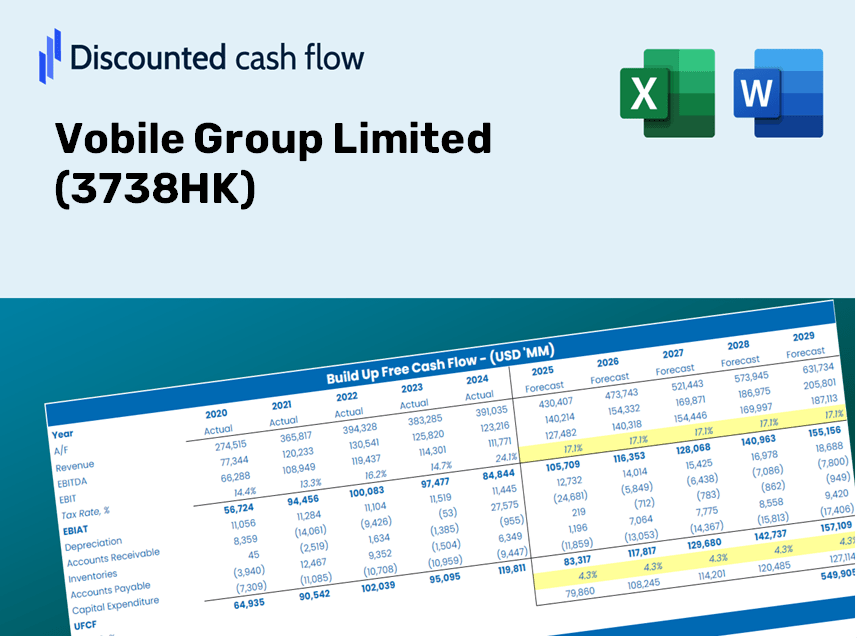
Vobile Group Limited (3738.hk) Valation DCF |
Entièrement Modifiable: Adapté À Vos Besoins Dans Excel Ou Sheets
Conception Professionnelle: Modèles Fiables Et Conformes Aux Normes Du Secteur
Pré-Construits Pour Une Utilisation Rapide Et Efficace
Compatible MAC/PC, entièrement débloqué
Aucune Expertise N'Est Requise; Facile À Suivre
Vobile Group Limited (3738.HK) Bundle
Rationalisez votre analyse et améliorez la précision avec notre calculatrice DCF (3738HK)! En utilisant des données réelles de Vobile Group Limited et personnalisables, cet outil vous permet de prévoir, analyser et valoriser Vobile comme un investisseur chevronné.
What You Will Receive
- Authentic Vobile Data: Comprehensive financials – including revenue and EBIT – sourced from actual and forecasted information.
- Complete Customization: Modify all essential parameters (yellow cells) such as WACC, growth %, and tax rates.
- Immediate Valuation Adjustments: Automatic recalculations to assess the effects of modifications on Vobile’s fair value.
- Flexible Excel Template: Designed for quick updates, scenario analysis, and in-depth forecasting.
- Efficient and Accurate: Avoid the hassle of creating models from the ground up while ensuring accuracy and adaptability.
Key Features
- Pre-Loaded Data: Vobile Group Limited’s historical financial statements and pre-filled forecasts.
- Fully Adjustable Inputs: Modify WACC, tax rates, revenue growth, and EBITDA margins as needed.
- Instant Results: View Vobile Group Limited’s intrinsic value recalculating in real time.
- Clear Visual Outputs: Dashboard charts present valuation results and key metrics effectively.
- Built for Accuracy: A professional tool designed for analysts, investors, and finance professionals.
How It Functions
- 1. Access the Template: Download and open the Excel file containing Vobile Group Limited’s (3738HK) prefilled data.
- 2. Modify Assumptions: Adjust essential inputs such as growth rates, WACC, and capital expenditures.
- 3. View Results Immediately: The DCF model automatically updates to reflect intrinsic value and NPV.
- 4. Explore Scenarios: Analyze various forecasts to evaluate different valuation results.
- 5. Utilize with Assurance: Present expert valuation insights to bolster your decision-making.
Why Opt for This Calculator?
- Precision: Accurate financials from Vobile Group Limited ensure reliable data.
- Adaptability: Built for users to easily test and adjust inputs as needed.
- Efficiency: Avoid the complexities of creating a DCF model from the ground up.
- Expert-Quality: Crafted with the professionalism and expertise expected at the CFO level.
- Intuitive: Simple to navigate, even for those without extensive financial modeling skills.
Who Can Benefit from This Product?
- Investors: Gain insights for informed investment choices with a top-tier valuation tool.
- Financial Analysts: Enhance efficiency with a customizable DCF model that’s ready to use.
- Consultants: Effortlessly modify the template for impactful client presentations and reports.
- Finance Enthusiasts: Expand your knowledge of valuation methods through practical, real-world examples.
- Educators and Students: Utilize this resource as a hands-on learning aid in finance courses.
Contents of the Template
- Detailed DCF Model: Editable framework featuring comprehensive valuation calculations.
- Real-World Data: Vobile Group Limited's (3738HK) historical and projected financials are preloaded for analysis.
- Customizable Parameters: Modify WACC, growth rates, and tax assumptions to explore various scenarios.
- Financial Statements: Complete annual and quarterly breakdowns for enhanced insights.
- Key Ratios: Integrated analysis for profitability, efficiency, and leverage metrics.
- Dashboard with Visual Outputs: Charts and tables designed to deliver clear, actionable insights.
Disclaimer
All information, articles, and product details provided on this website are for general informational and educational purposes only. We do not claim any ownership over, nor do we intend to infringe upon, any trademarks, copyrights, logos, brand names, or other intellectual property mentioned or depicted on this site. Such intellectual property remains the property of its respective owners, and any references here are made solely for identification or informational purposes, without implying any affiliation, endorsement, or partnership.
We make no representations or warranties, express or implied, regarding the accuracy, completeness, or suitability of any content or products presented. Nothing on this website should be construed as legal, tax, investment, financial, medical, or other professional advice. In addition, no part of this site—including articles or product references—constitutes a solicitation, recommendation, endorsement, advertisement, or offer to buy or sell any securities, franchises, or other financial instruments, particularly in jurisdictions where such activity would be unlawful.
All content is of a general nature and may not address the specific circumstances of any individual or entity. It is not a substitute for professional advice or services. Any actions you take based on the information provided here are strictly at your own risk. You accept full responsibility for any decisions or outcomes arising from your use of this website and agree to release us from any liability in connection with your use of, or reliance upon, the content or products found herein.