
|
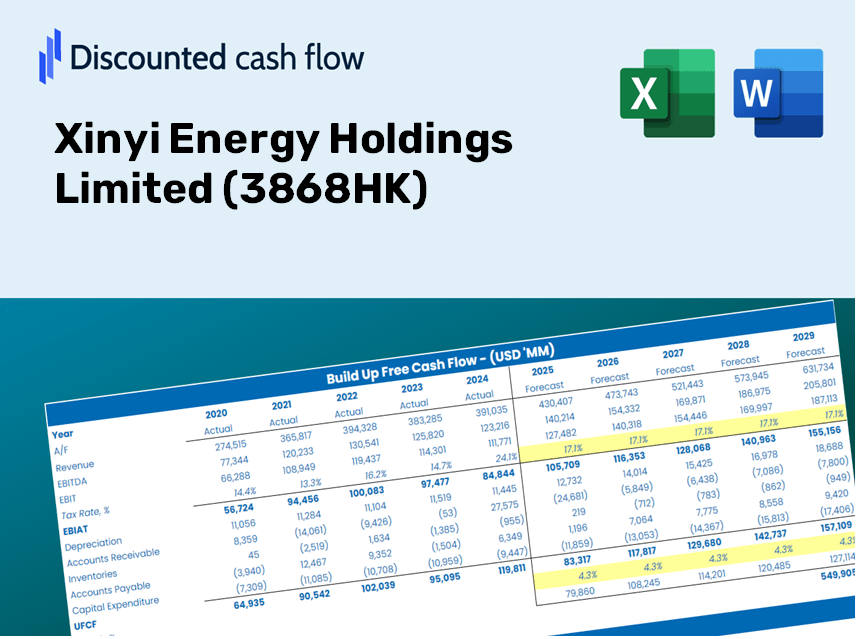
Xinyi Energy Holdings Limited (3868.hk) Valation DCF |
Entièrement Modifiable: Adapté À Vos Besoins Dans Excel Ou Sheets
Conception Professionnelle: Modèles Fiables Et Conformes Aux Normes Du Secteur
Pré-Construits Pour Une Utilisation Rapide Et Efficace
Compatible MAC/PC, entièrement débloqué
Aucune Expertise N'Est Requise; Facile À Suivre
Xinyi Energy Holdings Limited (3868.HK) Bundle
Gardez un aperçu de votre analyse d'évaluation Xinyi EnergyHing Holdings Limited (3868HK) à l'aide de notre calculatrice sophistiquée DCF! Ce modèle Excel est préchargé avec des données réelles (3868HK), vous permettant d'ajuster les prévisions et les hypothèses pour un calcul précis de la valeur intrinsèque de Xinyi Energy Holdings Limited.
Discounted Cash Flow (DCF) - (USD MM)
| Year | AY1 2020 |
AY2 2021 |
AY3 2022 |
AY4 2023 |
AY5 2024 |
FY1 2025 |
FY2 2026 |
FY3 2027 |
FY4 2028 |
FY5 2029 |
|---|---|---|---|---|---|---|---|---|---|---|
| Revenue | 1,722.1 | 2,296.6 | 2,315.3 | 2,517.4 | 2,596.8 | 2,869.4 | 3,170.5 | 3,503.3 | 3,871.0 | 4,277.2 |
| Revenue Growth, % | 0 | 33.37 | 0.81105 | 8.73 | 3.16 | 10.5 | 10.5 | 10.5 | 10.5 | 10.5 |
| EBITDA | 1,680.8 | 2,203.4 | 2,142.0 | 2,327.0 | 2,300.8 | 2,680.5 | 2,961.9 | 3,272.7 | 3,616.2 | 3,995.8 |
| EBITDA, % | 97.6 | 95.94 | 92.51 | 92.44 | 88.6 | 93.42 | 93.42 | 93.42 | 93.42 | 93.42 |
| Depreciation | 426.5 | 558.8 | 599.4 | 667.1 | 633.5 | 722.4 | 798.2 | 882.0 | 974.6 | 1,076.9 |
| Depreciation, % | 24.77 | 24.33 | 25.89 | 26.5 | 24.4 | 25.18 | 25.18 | 25.18 | 25.18 | 25.18 |
| EBIT | 1,254.3 | 1,644.6 | 1,542.6 | 1,659.9 | 1,667.2 | 1,958.1 | 2,163.6 | 2,390.7 | 2,641.6 | 2,918.9 |
| EBIT, % | 72.84 | 71.61 | 66.63 | 65.94 | 64.2 | 68.24 | 68.24 | 68.24 | 68.24 | 68.24 |
| Total Cash | 1,312.4 | 1,104.9 | 1,790.8 | 703.0 | 422.9 | 1,411.0 | 1,559.1 | 1,722.7 | 1,903.5 | 2,103.3 |
| Total Cash, percent | .0 | .0 | .0 | .0 | .0 | .0 | .0 | .0 | .0 | .0 |
| Account Receivables | 3,519.5 | 5,019.1 | 3,397.5 | 3,913.3 | 4,521.2 | 2,869.4 | 3,170.5 | 3,503.3 | 3,871.0 | 4,277.2 |
| Account Receivables, % | 204.38 | 218.54 | 146.74 | 155.45 | 174.11 | 100 | 100 | 100 | 100 | 100 |
| Inventories | .0 | .0 | .0 | .0 | .0 | .0 | .0 | .0 | .0 | .0 |
| Inventories, % | 0 | 0 | 0 | 0 | 0 | 0 | 0 | 0 | 0 | 0 |
| Accounts Payable | .0 | .0 | 2,119.4 | .0 | .0 | 525.3 | 580.4 | 641.4 | 708.7 | 783.1 |
| Accounts Payable, % | 0 | 0 | 91.54 | 0 | 0 | 18.31 | 18.31 | 18.31 | 18.31 | 18.31 |
| Capital Expenditure | -469.4 | -825.9 | -1,546.5 | -2,645.4 | -2,447.4 | -1,860.9 | -2,056.2 | -2,272.0 | -2,510.4 | -2,773.9 |
| Capital Expenditure, % | -27.26 | -35.96 | -66.8 | -105.08 | -94.25 | -64.85 | -64.85 | -64.85 | -64.85 | -64.85 |
| Tax Rate, % | 32.27 | 32.27 | 32.27 | 32.27 | 32.27 | 32.27 | 32.27 | 32.27 | 32.27 | 32.27 |
| EBITAT | 1,062.3 | 1,391.5 | 1,177.9 | 1,269.7 | 1,129.2 | 1,526.9 | 1,687.1 | 1,864.2 | 2,059.8 | 2,276.0 |
| Depreciation | ||||||||||
| Changes in Account Receivables | ||||||||||
| Changes in Inventories | ||||||||||
| Changes in Accounts Payable | ||||||||||
| Capital Expenditure | ||||||||||
| UFCF | -2,500.1 | -375.2 | 3,971.7 | -3,343.8 | -1,292.6 | 2,565.6 | 183.2 | 202.4 | 223.6 | 247.1 |
| WACC, % | 6.49 | 6.49 | 6.33 | 6.33 | 6.15 | 6.36 | 6.36 | 6.36 | 6.36 | 6.36 |
| PV UFCF | ||||||||||
| SUM PV UFCF | 3,098.7 | |||||||||
| Long Term Growth Rate, % | 3.00 | |||||||||
| Free cash flow (T + 1) | 255 | |||||||||
| Terminal Value | 7,578 | |||||||||
| Present Terminal Value | 5,568 | |||||||||
| Enterprise Value | 8,666 | |||||||||
| Net Debt | 8,462 | |||||||||
| Equity Value | 204 | |||||||||
| Diluted Shares Outstanding, MM | 8,283 | |||||||||
| Equity Value Per Share | 0.02 |
What You Will Receive
- Customizable Excel Template: A fully adjustable DCF Calculator in Excel, featuring pre-filled financial data for Xinyi Energy Holdings Limited (3868HK).
- Accurate Historical Data: Access to past performance data and projected estimates (highlighted in the yellow cells).
- Flexible Forecasting: Modify key assumptions such as revenue growth rates, EBITDA percentages, and WACC.
- Instant Calculations: Quickly see how your inputs affect the valuation of Xinyi Energy Holdings Limited (3868HK).
- Professional Grade Tool: Designed for investors, CFOs, consultants, and financial analysts.
- Intuitive User Interface: Organized for simplicity and user-friendliness, complete with step-by-step guidance.
Key Features
- Pre-Loaded Data: Historical financial statements and forecasts for Xinyi Energy Holdings Limited (3868HK).
- Fully Adjustable Inputs: Customize WACC, tax rates, revenue growth, and EBITDA margins according to your analysis.
- Instant Results: Watch the intrinsic value for Xinyi Energy Holdings Limited (3868HK) recalculate in real-time.
- Clear Visual Outputs: Dashboard charts present valuation results and essential metrics clearly.
- Built for Accuracy: A reliable tool designed for analysts, investors, and finance professionals.
How It Operates
- Download the Template: Gain immediate access to the Excel-based Xinyi Energy Holdings DCF Calculator.
- Input Your Assumptions: Modify the yellow-highlighted cells for growth rates, WACC, profit margins, and other variables.
- Instant Calculations: The model dynamically updates the intrinsic value of Xinyi Energy Holdings.
- Test Scenarios: Experiment with various assumptions to assess potential changes in valuation.
- Analyze and Decide: Leverage the results to inform your investment or financial decisions.
Why Opt for This Calculator?
- Designed for Experts: A sophisticated tool utilized by analysts, CFOs, and financial consultants.
- Accurate Data: Xinyi Energy Holdings Limited’s historical and forecasted financial data is preloaded for precise assessments.
- Scenario Analysis: Effortlessly simulate various forecasts and assumptions.
- Comprehensive Outputs: Instantly calculates intrinsic value, NPV, and essential metrics.
- User-Friendly: Step-by-step instructions lead you through the calculations with ease.
Who Should Benefit from This Product?
- Investors: Assess the valuation of Xinyi Energy Holdings Limited (3868HK) prior to making investment decisions.
- CFOs and Financial Analysts: Optimize valuation methodologies and validate financial forecasts.
- Startup Founders: Understand the valuation strategies used by established companies like Xinyi Energy Holdings Limited (3868HK).
- Consultants: Provide comprehensive valuation reports to your clients based on Xinyi Energy Holdings Limited (3868HK).
- Students and Educators: Utilize real-world data from Xinyi Energy Holdings Limited (3868HK) to practice and instruct on valuation methods.
Contents of the Template
- Preloaded Xinyi Energy Data: Historical and projected financial metrics, including revenue, EBIT, and capital expenditures.
- DCF and WACC Models: Advanced sheets for computing intrinsic value and Weighted Average Cost of Capital.
- Editable Inputs: Cells highlighted in yellow for modifying revenue growth, tax rates, and discount rates.
- Financial Statements: Detailed annual and quarterly financial reports for in-depth analysis.
- Key Ratios: Ratios for profitability, leverage, and efficiency to assess performance.
- Dashboard and Charts: Visual representations of valuation results and underlying assumptions.
Disclaimer
All information, articles, and product details provided on this website are for general informational and educational purposes only. We do not claim any ownership over, nor do we intend to infringe upon, any trademarks, copyrights, logos, brand names, or other intellectual property mentioned or depicted on this site. Such intellectual property remains the property of its respective owners, and any references here are made solely for identification or informational purposes, without implying any affiliation, endorsement, or partnership.
We make no representations or warranties, express or implied, regarding the accuracy, completeness, or suitability of any content or products presented. Nothing on this website should be construed as legal, tax, investment, financial, medical, or other professional advice. In addition, no part of this site—including articles or product references—constitutes a solicitation, recommendation, endorsement, advertisement, or offer to buy or sell any securities, franchises, or other financial instruments, particularly in jurisdictions where such activity would be unlawful.
All content is of a general nature and may not address the specific circumstances of any individual or entity. It is not a substitute for professional advice or services. Any actions you take based on the information provided here are strictly at your own risk. You accept full responsibility for any decisions or outcomes arising from your use of this website and agree to release us from any liability in connection with your use of, or reliance upon, the content or products found herein.