
|
China International Capital Corporation Limited (3908.HK) Évaluation DCF |
Entièrement Modifiable: Adapté À Vos Besoins Dans Excel Ou Sheets
Conception Professionnelle: Modèles Fiables Et Conformes Aux Normes Du Secteur
Pré-Construits Pour Une Utilisation Rapide Et Efficace
Compatible MAC/PC, entièrement débloqué
Aucune Expertise N'Est Requise; Facile À Suivre
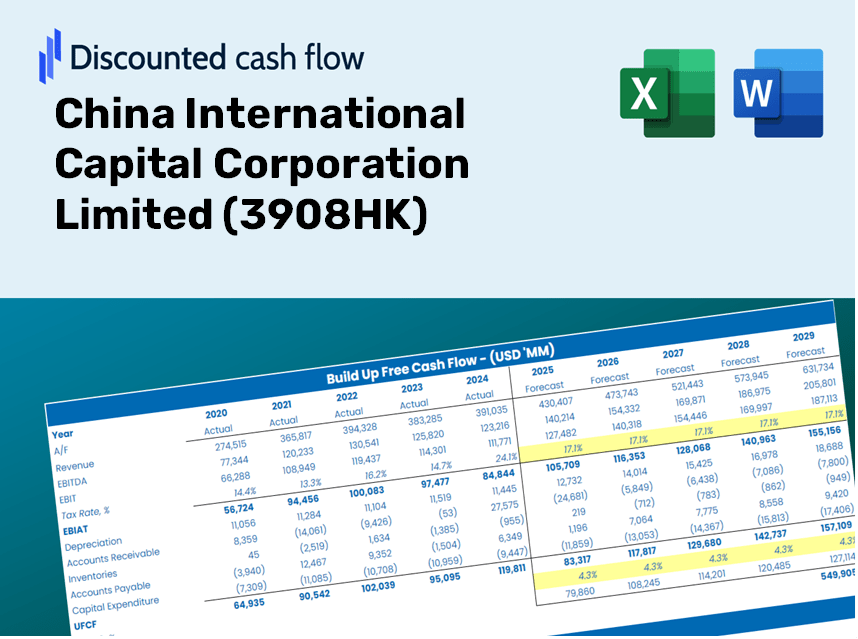
China International Capital Corporation Limited (3908.HK) Bundle
Conçu pour la précision, notre calculatrice DCF (3908HK) vous permet d'évaluer l'évaluation de China International Capital Corporation Limited à l'aide de données financières du monde réel et offre une flexibilité complète pour modifier tous les paramètres essentiels pour des projections améliorées.
Discounted Cash Flow (DCF) - (USD MM)
| Year | AY1 2020 |
AY2 2021 |
AY3 2022 |
AY4 2023 |
AY5 2024 |
FY1 2025 |
FY2 2026 |
FY3 2027 |
FY4 2028 |
FY5 2029 |
|---|---|---|---|---|---|---|---|---|---|---|
| Revenue | 37,632.8 | 45,333.6 | 40,263.9 | 36,108.1 | 21,464.9 | 19,232.8 | 17,232.8 | 15,440.8 | 13,835.1 | 12,396.5 |
| Revenue Growth, % | 0 | 20.46 | -11.18 | -10.32 | -40.55 | -10.4 | -10.4 | -10.4 | -10.4 | -10.4 |
| EBITDA | 17,961.5 | 24,522.2 | 21,734.1 | 21,140.7 | 17,073.9 | 11,304.7 | 10,129.2 | 9,075.9 | 8,132.1 | 7,286.4 |
| EBITDA, % | 47.73 | 54.09 | 53.98 | 58.55 | 79.54 | 58.78 | 58.78 | 58.78 | 58.78 | 58.78 |
| Depreciation | 1,094.2 | 1,293.1 | 1,798.8 | 1,937.2 | 2,088.3 | 974.0 | 872.7 | 782.0 | 700.6 | 627.8 |
| Depreciation, % | 2.91 | 2.85 | 4.47 | 5.36 | 9.73 | 5.06 | 5.06 | 5.06 | 5.06 | 5.06 |
| EBIT | 16,867.2 | 23,229.0 | 19,935.4 | 19,203.5 | 14,985.6 | 10,330.7 | 9,256.5 | 8,293.9 | 7,431.4 | 6,658.6 |
| EBIT, % | 44.82 | 51.24 | 49.51 | 53.18 | 69.81 | 53.71 | 53.71 | 53.71 | 53.71 | 53.71 |
| Total Cash | 374,814.8 | 466,945.7 | 479,779.4 | 472,237.4 | .1 | 15,386.3 | 13,786.3 | 12,352.7 | 11,068.1 | 9,917.2 |
| Total Cash, percent | .0 | .0 | .0 | .0 | .0 | .0 | .0 | .0 | .0 | .0 |
| Account Receivables | 85,351.0 | 94,276.4 | 81,352.3 | 76,340.0 | 91,615.1 | 19,232.8 | 17,232.8 | 15,440.8 | 13,835.1 | 12,396.5 |
| Account Receivables, % | 226.8 | 207.96 | 202.05 | 211.42 | 426.81 | 100 | 100 | 100 | 100 | 100 |
| Inventories | .0 | .0 | .0 | .0 | .0 | .0 | .0 | .0 | .0 | .0 |
| Inventories, % | 0 | 0 | 0 | 0 | 0 | 0 | 0 | 0 | 0 | 0 |
| Accounts Payable | 163,345.9 | 257,511.3 | 219,947.6 | 194,445.0 | 224,177.0 | 19,232.8 | 17,232.8 | 15,440.8 | 13,835.1 | 12,396.5 |
| Accounts Payable, % | 434.05 | 568.04 | 546.27 | 538.51 | 1044.39 | 100 | 100 | 100 | 100 | 100 |
| Capital Expenditure | -503.2 | -1,157.3 | -1,734.1 | -1,596.1 | -1,030.1 | -669.9 | -600.3 | -537.8 | -481.9 | -431.8 |
| Capital Expenditure, % | -1.34 | -2.55 | -4.31 | -4.42 | -4.8 | -3.48 | -3.48 | -3.48 | -3.48 | -3.48 |
| Tax Rate, % | 16.32 | 16.32 | 16.32 | 16.32 | 16.32 | 16.32 | 16.32 | 16.32 | 16.32 | 16.32 |
| EBITAT | 13,953.2 | 19,290.6 | 16,724.8 | 17,326.6 | 12,539.9 | 8,751.6 | 7,841.5 | 7,026.1 | 6,295.5 | 5,640.8 |
| Depreciation | ||||||||||
| Changes in Account Receivables | ||||||||||
| Changes in Inventories | ||||||||||
| Changes in Accounts Payable | ||||||||||
| Capital Expenditure | ||||||||||
| UFCF | 92,539.2 | 104,666.4 | -7,850.1 | -2,822.7 | 28,055.0 | -123,506.2 | 8,114.0 | 7,270.2 | 6,514.2 | 5,836.8 |
| WACC, % | 4.09 | 4.1 | 4.12 | 4.3 | 4.12 | 4.15 | 4.15 | 4.15 | 4.15 | 4.15 |
| PV UFCF | ||||||||||
| SUM PV UFCF | -94,370.8 | |||||||||
| Long Term Growth Rate, % | 2.00 | |||||||||
| Free cash flow (T + 1) | 5,954 | |||||||||
| Terminal Value | 277,184 | |||||||||
| Present Terminal Value | 226,212 | |||||||||
| Enterprise Value | 131,841 | |||||||||
| Net Debt | 262,221 | |||||||||
| Equity Value | -130,380 | |||||||||
| Diluted Shares Outstanding, MM | 4,827 | |||||||||
| Equity Value Per Share | -27.01 |
What You Will Receive
- Customizable Excel Template: A fully editable Excel DCF Calculator featuring pre-filled financial data for CICC (3908HK).
- Real-World Financials: Access to historical data and forward-looking projections (highlighted in the yellow cells).
- Flexible Forecasting: Adjust key assumptions such as revenue growth, EBITDA margins, and WACC.
- Instant Calculations: Quickly visualize how your inputs affect the valuation of China International Capital Corporation (3908HK).
- Professional Resource: Designed for investors, CFOs, consultants, and financial analysts.
- User-Friendly Interface: Organized for simplicity and ease of navigation, complete with step-by-step guidance.
Key Features
- Authentic CICC Data: Equipped with historical financials and forward-looking projections for China International Capital Corporation Limited (3908HK).
- Comprehensive Customization: Tailor inputs such as revenue growth, profit margins, WACC, tax rates, and capital expenditures to fit your analysis.
- Adaptive Valuation Framework: Automatically refreshes Net Present Value (NPV) and intrinsic value calculations based on user-defined parameters.
- Scenario Analysis: Generate various forecast scenarios to evaluate different valuation possibilities.
- Intuitive Interface: Designed for ease of use, making it accessible for both seasoned professionals and newcomers.
Operational Overview
- Download: Obtain the preformatted Excel file featuring China International Capital Corporation Limited’s (3908HK) financial metrics.
- Customize: Modify projections such as revenue increases, EBITDA percentage, and WACC.
- Real-Time Updates: The intrinsic value and NPV figures refresh automatically as you make changes.
- Scenario Analysis: Generate various forecasts and evaluate different results on the spot.
- Informed Decisions: Leverage the valuation outcomes to shape your investment approach.
Why Select This Calculator for China International Capital Corporation Limited (3908HK)?
- User-Friendly Interface: Tailored for both novices and seasoned professionals.
- Customizable Inputs: Easily adjust parameters to suit your financial analysis needs.
- Real-Time Valuation Updates: Monitor immediate changes to CICC's valuation as you tweak your inputs.
- Preloaded Financial Data: Comes equipped with CICC's actual financial figures for rapid assessment.
- Relied Upon by Experts: A go-to tool for investors and analysts seeking actionable insights.
Who Can Benefit from CICC's Services?
- Investors: Enhance your investment strategies with insights from a leading financial institution.
- Financial Analysts: Streamline your analysis process with our advanced tools and resources tailored for efficiency.
- Consultants: Effortlessly modify our comprehensive materials for impactful client presentations or reports.
- Finance Enthusiasts: Expand your knowledge of market dynamics through practical, real-world applications.
- Educators and Students: Utilize our resources as a hands-on learning aid in finance and investment courses.
Contents of the Template
- Historical Data: Contains CICC's (3908HK) previous financial performance and foundational forecasts.
- DCF and Levered DCF Models: Comprehensive templates designed to ascertain CICC's (3908HK) intrinsic value.
- WACC Sheet: Pre-calculated metrics for Weighted Average Cost of Capital.
- Editable Inputs: Adjust critical factors such as growth rates, EBITDA %, and CAPEX estimates.
- Quarterly and Annual Statements: A thorough analysis of CICC's (3908HK) financial statements.
- Interactive Dashboard: A dynamic tool for visualizing valuation outcomes and forecasts.
Disclaimer
All information, articles, and product details provided on this website are for general informational and educational purposes only. We do not claim any ownership over, nor do we intend to infringe upon, any trademarks, copyrights, logos, brand names, or other intellectual property mentioned or depicted on this site. Such intellectual property remains the property of its respective owners, and any references here are made solely for identification or informational purposes, without implying any affiliation, endorsement, or partnership.
We make no representations or warranties, express or implied, regarding the accuracy, completeness, or suitability of any content or products presented. Nothing on this website should be construed as legal, tax, investment, financial, medical, or other professional advice. In addition, no part of this site—including articles or product references—constitutes a solicitation, recommendation, endorsement, advertisement, or offer to buy or sell any securities, franchises, or other financial instruments, particularly in jurisdictions where such activity would be unlawful.
All content is of a general nature and may not address the specific circumstances of any individual or entity. It is not a substitute for professional advice or services. Any actions you take based on the information provided here are strictly at your own risk. You accept full responsibility for any decisions or outcomes arising from your use of this website and agree to release us from any liability in connection with your use of, or reliance upon, the content or products found herein.