
|
Denka Company Limited (4061.T) Évaluation DCF |
Entièrement Modifiable: Adapté À Vos Besoins Dans Excel Ou Sheets
Conception Professionnelle: Modèles Fiables Et Conformes Aux Normes Du Secteur
Pré-Construits Pour Une Utilisation Rapide Et Efficace
Compatible MAC/PC, entièrement débloqué
Aucune Expertise N'Est Requise; Facile À Suivre
Denka Company Limited (4061.T) Bundle
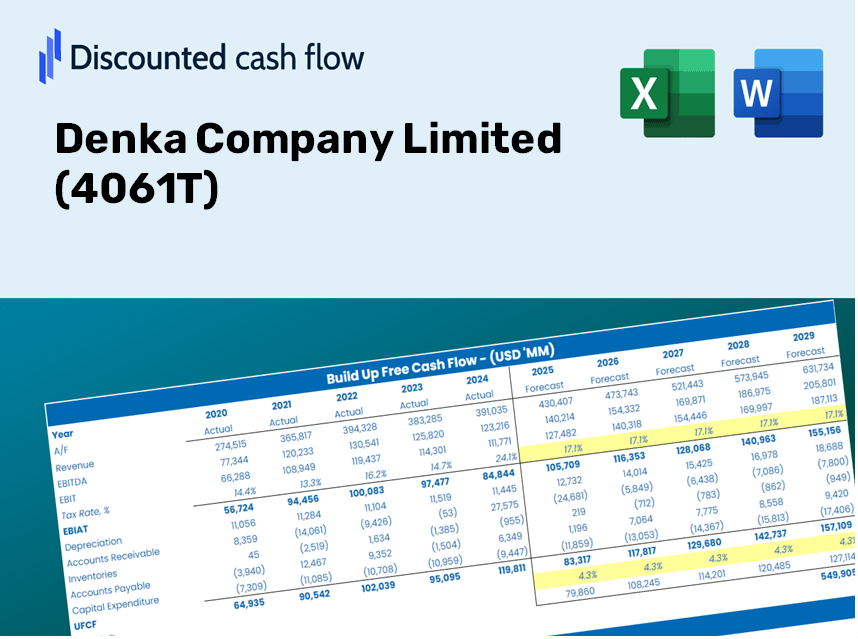
Gardez un aperçu de votre analyse d'évaluation de votre société Denka Company Limited (4061T) à l'aide de notre calculatrice sophistiquée DCF! Ce modèle Excel est préchargé avec des données réelles (4061T), vous permettant d'ajuster les prévisions et les hypothèses pour déterminer avec précision la valeur intrinsèque de Denka Company Limited.
Discounted Cash Flow (DCF) - (USD MM)
| Year | AY1 2021 |
AY2 2022 |
AY3 2023 |
AY4 2024 |
AY5 2025 |
FY1 2026 |
FY2 2027 |
FY3 2028 |
FY4 2029 |
FY5 2030 |
|---|---|---|---|---|---|---|---|---|---|---|
| Revenue | 354,391.0 | 384,849.0 | 407,559.0 | 389,263.0 | 400,251.0 | 413,088.1 | 426,337.0 | 440,010.8 | 454,123.1 | 468,688.1 |
| Revenue Growth, % | 0 | 8.59 | 5.9 | -4.49 | 2.82 | 3.21 | 3.21 | 3.21 | 3.21 | 3.21 |
| EBITDA | 52,784.0 | 59,439.0 | 59,365.0 | 43,085.0 | 12,867.0 | 48,899.8 | 50,468.2 | 52,086.8 | 53,757.4 | 55,481.5 |
| EBITDA, % | 14.89 | 15.44 | 14.57 | 11.07 | 3.21 | 11.84 | 11.84 | 11.84 | 11.84 | 11.84 |
| Depreciation | 22,911.0 | 23,882.0 | 27,040.0 | 26,919.0 | 27,857.0 | 27,412.8 | 28,292.0 | 29,199.4 | 30,135.9 | 31,102.4 |
| Depreciation, % | 6.46 | 6.21 | 6.63 | 6.92 | 6.96 | 6.64 | 6.64 | 6.64 | 6.64 | 6.64 |
| EBIT | 29,873.0 | 35,557.0 | 32,325.0 | 16,166.0 | -14,990.0 | 21,487.0 | 22,176.2 | 22,887.4 | 23,621.5 | 24,379.1 |
| EBIT, % | 8.43 | 9.24 | 7.93 | 4.15 | -3.75 | 5.2 | 5.2 | 5.2 | 5.2 | 5.2 |
| Total Cash | 25,910.0 | 20,210.0 | 20,199.0 | 35,386.0 | 37,002.0 | 29,621.6 | 30,571.6 | 31,552.2 | 32,564.1 | 33,608.5 |
| Total Cash, percent | .0 | .0 | .0 | .0 | .0 | .0 | .0 | .0 | .0 | .0 |
| Account Receivables | 92,621.0 | 100,808.0 | 97,865.0 | 96,182.0 | 88,035.0 | 101,657.3 | 104,917.8 | 108,282.8 | 111,755.7 | 115,340.0 |
| Account Receivables, % | 26.14 | 26.19 | 24.01 | 24.71 | 21.99 | 24.61 | 24.61 | 24.61 | 24.61 | 24.61 |
| Inventories | 71,714.0 | 85,658.0 | 121,121.0 | 121,616.0 | 130,504.0 | 112,409.7 | 116,015.0 | 119,735.9 | 123,576.2 | 127,539.6 |
| Inventories, % | 20.24 | 22.26 | 29.72 | 31.24 | 32.61 | 27.21 | 27.21 | 27.21 | 27.21 | 27.21 |
| Accounts Payable | 40,188.0 | 50,032.0 | 47,969.0 | 54,193.0 | 48,023.0 | 51,248.1 | 52,891.7 | 54,588.1 | 56,338.9 | 58,145.9 |
| Accounts Payable, % | 11.34 | 13 | 11.77 | 13.92 | 12 | 12.41 | 12.41 | 12.41 | 12.41 | 12.41 |
| Capital Expenditure | -37,494.0 | -37,954.0 | -39,840.0 | -44,679.0 | -59,830.0 | -46,797.2 | -48,298.1 | -49,847.2 | -51,445.9 | -53,095.9 |
| Capital Expenditure, % | -10.58 | -9.86 | -9.78 | -11.48 | -14.95 | -11.33 | -11.33 | -11.33 | -11.33 | -11.33 |
| Tax Rate, % | 28 | 28 | 28 | 28 | 28 | 28 | 28 | 28 | 28 | 28 |
| EBITAT | 23,428.9 | 26,706.0 | 28,288.3 | 13,335.3 | -10,793.0 | 16,997.9 | 17,543.1 | 18,105.7 | 18,686.4 | 19,285.8 |
| Depreciation | ||||||||||
| Changes in Account Receivables | ||||||||||
| Changes in Inventories | ||||||||||
| Changes in Accounts Payable | ||||||||||
| Capital Expenditure | ||||||||||
| UFCF | -115,301.1 | 347.0 | -19,094.7 | 2,987.3 | -49,677.0 | 5,310.5 | -7,685.1 | -7,931.6 | -8,186.0 | -8,448.5 |
| WACC, % | 3.63 | 3.57 | 3.8 | 3.71 | 3.51 | 3.64 | 3.64 | 3.64 | 3.64 | 3.64 |
| PV UFCF | ||||||||||
| SUM PV UFCF | -23,315.3 | |||||||||
| Long Term Growth Rate, % | 3.50 | |||||||||
| Free cash flow (T + 1) | -8,744 | |||||||||
| Terminal Value | -6,199,937 | |||||||||
| Present Terminal Value | -5,184,759 | |||||||||
| Enterprise Value | -5,208,074 | |||||||||
| Net Debt | 180,677 | |||||||||
| Equity Value | -5,388,751 | |||||||||
| Diluted Shares Outstanding, MM | 86 | |||||||||
| Equity Value Per Share | -62,531.20 |
What You Will Receive
- Pre-Filled Financial Model: Utilize Denka Company Limited's (4061T) actual data for accurate DCF valuation.
- Comprehensive Forecast Control: Easily modify revenue growth, margins, WACC, and other essential variables.
- Real-Time Calculations: Automatic updates provide immediate insights as you adjust parameters.
- Professional-Grade Template: A polished Excel file designed for high-quality valuation presentations.
- Flexible and Reusable: Customizable for various scenarios, enabling repeated use for in-depth forecasts.
Key Features
- Genuine Denka Financials: Obtain reliable pre-loaded historical data alongside future projections for [Symbol].
- Tailorable Forecast Assumptions: Modify yellow-highlighted cells, including WACC, growth rates, and margins specific to [Symbol].
- Real-Time Calculations: Automatic updates to DCF, Net Present Value (NPV), and cash flow analysis tailored for [Symbol].
- Insightful Dashboard: User-friendly charts and summaries to effectively visualize valuation results for [Symbol].
- Aimed at All Skill Levels: An intuitive design created for investors, CFOs, and consultants, suitable for both novices and professionals dealing with [Symbol].
How It Operates
- 1. Access the Template: Download and open the Excel file containing Denka Company Limited's (4061T) preloaded data.
- 2. Modify Assumptions: Adjust essential inputs such as growth rates, WACC, and capital expenditures.
- 3. Receive Instant Results: The DCF model instantly calculates the intrinsic value and NPV.
- 4. Explore Different Scenarios: Analyze various forecasts to evaluate multiple valuation outcomes.
- 5. Present with Confidence: Deliver professional valuation insights to bolster your decision-making process.
Why Opt for This Calculator for Denka Company Limited (4061T)?
- User-Friendly Interface: Crafted for both novices and seasoned users.
- Customizable Inputs: Adjust parameters effortlessly to suit your analysis needs.
- Real-Time Feedback: Observe immediate updates to Denka’s valuation as you tweak inputs.
- Preloaded Data: Comes equipped with Denka’s actual financial statistics for swift evaluations.
- Relied Upon by Experts: Favored by investors and analysts for making informed choices.
Who Can Benefit from This Product?
- Institutional Investors: Create comprehensive and trustworthy valuation models for portfolio assessments related to Denka Company Limited (4061T).
- Finance Departments: Evaluate valuation scenarios to inform strategic decisions within their organizations.
- Financial Consultants and Advisors: Deliver precise valuation analyses to clients interested in Denka Company Limited (4061T).
- Students and Instructors: Utilize real-time data to enhance learning and practice in financial modeling.
- Industry Analysts: Gain insights into how companies like Denka Company Limited (4061T) are valued in the marketplace.
Contents of the Template
- Pre-Filled DCF Model: Denka Company Limited’s financial data ready for immediate application.
- WACC Calculator: Comprehensive calculations for the Weighted Average Cost of Capital.
- Financial Ratios: Examine Denka’s profitability, leverage, and operational efficiency.
- Editable Inputs: Adjust assumptions like growth rates, margins, and CAPEX to match your scenarios.
- Financial Statements: Access annual and quarterly reports for thorough analysis.
- Interactive Dashboard: Effortlessly visualize essential valuation metrics and outcomes.
Disclaimer
All information, articles, and product details provided on this website are for general informational and educational purposes only. We do not claim any ownership over, nor do we intend to infringe upon, any trademarks, copyrights, logos, brand names, or other intellectual property mentioned or depicted on this site. Such intellectual property remains the property of its respective owners, and any references here are made solely for identification or informational purposes, without implying any affiliation, endorsement, or partnership.
We make no representations or warranties, express or implied, regarding the accuracy, completeness, or suitability of any content or products presented. Nothing on this website should be construed as legal, tax, investment, financial, medical, or other professional advice. In addition, no part of this site—including articles or product references—constitutes a solicitation, recommendation, endorsement, advertisement, or offer to buy or sell any securities, franchises, or other financial instruments, particularly in jurisdictions where such activity would be unlawful.
All content is of a general nature and may not address the specific circumstances of any individual or entity. It is not a substitute for professional advice or services. Any actions you take based on the information provided here are strictly at your own risk. You accept full responsibility for any decisions or outcomes arising from your use of this website and agree to release us from any liability in connection with your use of, or reliance upon, the content or products found herein.