
|
Nippon Shinyaku Co., Ltd. (4516.T) Évaluation DCF |
Entièrement Modifiable: Adapté À Vos Besoins Dans Excel Ou Sheets
Conception Professionnelle: Modèles Fiables Et Conformes Aux Normes Du Secteur
Pré-Construits Pour Une Utilisation Rapide Et Efficace
Compatible MAC/PC, entièrement débloqué
Aucune Expertise N'Est Requise; Facile À Suivre
Nippon Shinyaku Co., Ltd. (4516.T) Bundle
Pour les investisseurs et les analystes, cette calculatrice [symbole] DCF est la ressource idéale pour une évaluation précise. Équipé de données réelles de Nippon Shinyaku Co., Ltd., vous pouvez ajuster les prévisions et observer les effets en temps réel.
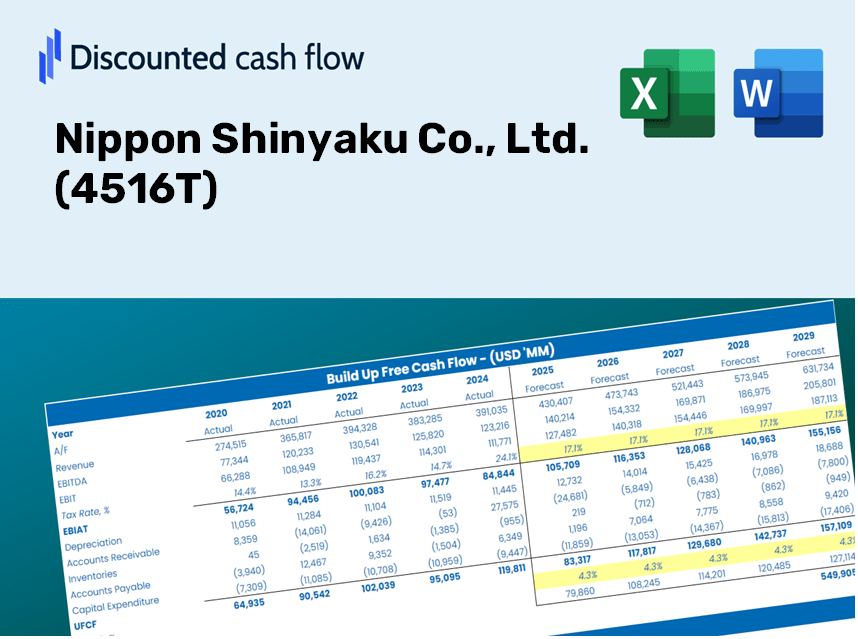
Discounted Cash Flow (DCF) - (USD MM)
| Year | AY1 2021 |
AY2 2022 |
AY3 2023 |
AY4 2024 |
AY5 2025 |
FY1 2026 |
FY2 2027 |
FY3 2028 |
FY4 2029 |
FY5 2030 |
|---|---|---|---|---|---|---|---|---|---|---|
| Revenue | 121,885.0 | 137,484.0 | 144,175.0 | 148,255.0 | 160,232.0 | 171,677.9 | 183,941.5 | 197,081.1 | 211,159.3 | 226,243.2 |
| Revenue Growth, % | 0 | 12.8 | 4.87 | 2.83 | 8.08 | 7.14 | 7.14 | 7.14 | 7.14 | 7.14 |
| EBITDA | 32,091.0 | 36,593.0 | 34,270.0 | 36,290.0 | 42,297.0 | 43,808.9 | 46,938.3 | 50,291.3 | 53,883.7 | 57,732.9 |
| EBITDA, % | 26.33 | 26.62 | 23.77 | 24.48 | 26.4 | 25.52 | 25.52 | 25.52 | 25.52 | 25.52 |
| Depreciation | 4,400.0 | 4,588.0 | 5,041.0 | 5,023.0 | 6,015.0 | 6,038.1 | 6,469.4 | 6,931.6 | 7,426.7 | 7,957.2 |
| Depreciation, % | 3.61 | 3.34 | 3.5 | 3.39 | 3.75 | 3.52 | 3.52 | 3.52 | 3.52 | 3.52 |
| EBIT | 27,691.0 | 32,005.0 | 29,229.0 | 31,267.0 | 36,282.0 | 37,770.8 | 40,468.9 | 43,359.7 | 46,457.0 | 49,775.6 |
| EBIT, % | 22.72 | 23.28 | 20.27 | 21.09 | 22.64 | 22 | 22 | 22 | 22 | 22 |
| Total Cash | 60,799.0 | 65,740.0 | 71,601.0 | 68,703.0 | 55,241.0 | 78,346.3 | 83,942.8 | 89,939.2 | 96,363.8 | 103,247.4 |
| Total Cash, percent | .0 | .0 | .0 | .0 | .0 | .0 | .0 | .0 | .0 | .0 |
| Account Receivables | 40,199.0 | 43,178.0 | 44,686.0 | 47,237.0 | 42,292.0 | 52,752.3 | 56,520.6 | 60,558.1 | 64,883.9 | 69,518.8 |
| Account Receivables, % | 32.98 | 31.41 | 30.99 | 31.86 | 26.39 | 30.73 | 30.73 | 30.73 | 30.73 | 30.73 |
| Inventories | 35,523.0 | 38,066.0 | 36,358.0 | 39,111.0 | 42,500.0 | 46,337.7 | 49,647.7 | 53,194.2 | 56,994.1 | 61,065.4 |
| Inventories, % | 29.14 | 27.69 | 25.22 | 26.38 | 26.52 | 26.99 | 26.99 | 26.99 | 26.99 | 26.99 |
| Accounts Payable | 2,924.0 | 12,674.0 | 14,490.0 | 24,706.0 | 16,857.0 | 16,773.9 | 17,972.1 | 19,255.9 | 20,631.4 | 22,105.2 |
| Accounts Payable, % | 2.4 | 9.22 | 10.05 | 16.66 | 10.52 | 9.77 | 9.77 | 9.77 | 9.77 | 9.77 |
| Capital Expenditure | -2,168.0 | -3,137.0 | -5,660.0 | -5,058.0 | -3,352.0 | -4,631.8 | -4,962.7 | -5,317.2 | -5,697.0 | -6,104.0 |
| Capital Expenditure, % | -1.78 | -2.28 | -3.93 | -3.41 | -2.09 | -2.7 | -2.7 | -2.7 | -2.7 | -2.7 |
| Tax Rate, % | 9.9 | 9.9 | 9.9 | 9.9 | 9.9 | 9.9 | 9.9 | 9.9 | 9.9 | 9.9 |
| EBITAT | 18,814.4 | 24,013.6 | 21,869.3 | 24,044.6 | 32,690.4 | 29,068.2 | 31,144.6 | 33,369.4 | 35,753.1 | 38,307.0 |
| Depreciation | ||||||||||
| Changes in Account Receivables | ||||||||||
| Changes in Inventories | ||||||||||
| Changes in Accounts Payable | ||||||||||
| Capital Expenditure | ||||||||||
| UFCF | -51,751.6 | 29,692.6 | 23,266.3 | 28,921.6 | 29,060.4 | 16,093.3 | 26,771.2 | 28,683.6 | 30,732.5 | 32,927.9 |
| WACC, % | 4.64 | 4.65 | 4.65 | 4.65 | 4.66 | 4.65 | 4.65 | 4.65 | 4.65 | 4.65 |
| PV UFCF | ||||||||||
| SUM PV UFCF | 116,718.6 | |||||||||
| Long Term Growth Rate, % | 2.00 | |||||||||
| Free cash flow (T + 1) | 33,586 | |||||||||
| Terminal Value | 1,268,785 | |||||||||
| Present Terminal Value | 1,011,001 | |||||||||
| Enterprise Value | 1,127,719 | |||||||||
| Net Debt | -52,519 | |||||||||
| Equity Value | 1,180,238 | |||||||||
| Diluted Shares Outstanding, MM | 67 | |||||||||
| Equity Value Per Share | 17,518.23 |
What You Will Receive
- Genuine 4516T Financials: Access to historical and projected data for precise valuation.
- Customizable Inputs: Adjust WACC, tax rates, revenue growth, and capital expenditures to fit your needs.
- Dynamic Calculations: Intrinsic value and NPV are computed automatically.
- Scenario Analysis: Evaluate multiple scenarios to assess Nippon Shinyaku's future performance.
- User-Friendly Design: Crafted for professionals, yet easy enough for beginners to navigate.
Key Features
- Comprehensive DCF Calculator: Features detailed unlevered and levered DCF valuation models tailored for Nippon Shinyaku Co., Ltd. (4516T).
- WACC Analysis Tool: Pre-configured Weighted Average Cost of Capital sheet with adjustable inputs for personalized analysis.
- Customizable Forecast Assumptions: Adjust growth rates, capital expenditures, and discount rates to fit your analysis needs.
- Integrated Financial Ratios: Examine profitability, leverage, and efficiency ratios specifically for Nippon Shinyaku Co., Ltd. (4516T).
- User-Friendly Dashboard and Charts: Visual representations of key valuation metrics for streamlined analysis.
How It Works
- Step 1: Download the Excel file for Nippon Shinyaku Co., Ltd. (4516T).
- Step 2: Examine the pre-filled financial data and forecasts for Nippon Shinyaku.
- Step 3: Adjust key inputs such as revenue growth, WACC, and tax rates (highlighted cells).
- Step 4: Observe the DCF model refresh in real-time as you modify your assumptions.
- Step 5: Review the outputs and leverage the findings for your investment strategies.
Why Opt for This Calculator?
- Reliable Data: Authentic Nippon Shinyaku Co., Ltd. (4516T) financials provide dependable valuation outcomes.
- Flexible Options: Modify essential parameters such as growth rates, WACC, and tax rates to align with your forecasts.
- Efficient: Pre-configured calculations save you from starting from the ground up.
- Professional Quality: Tailored for investors, analysts, and consultants alike.
- User-Friendly Design: Easy-to-navigate interface and step-by-step guidance cater to users of all levels.
Who Can Benefit from This Product?
- Pharmaceutical Students: Master drug development processes and analyze real-world data.
- Researchers: Use advanced models to enhance your academic studies and publications.
- Investors: Validate your investment hypotheses and evaluate valuation scenarios for Nippon Shinyaku Co., Ltd. (4516T).
- Market Analysts: Optimize your analysis with a customizable model tailored for pharmaceutical assessments.
- Healthcare Entrepreneurs: Understand the analytical approaches used for evaluating major players like Nippon Shinyaku Co., Ltd. (4516T).
Overview of the Template Features
- Comprehensive DCF Model: An editable framework with in-depth valuation calculations.
- Real-World Data: Nippon Shinyaku Co., Ltd.'s (4516T) historical and projected financials included for thorough analysis.
- Customizable Parameters: Modify WACC, growth rates, and tax assumptions to explore various scenarios.
- Financial Statements: Complete annual and quarterly breakdowns for enhanced insights.
- Key Ratios: Integrated analysis for assessing profitability, efficiency, and leverage.
- Dashboard with Visual Outputs: Graphs and tables that present clear, actionable results.
Disclaimer
All information, articles, and product details provided on this website are for general informational and educational purposes only. We do not claim any ownership over, nor do we intend to infringe upon, any trademarks, copyrights, logos, brand names, or other intellectual property mentioned or depicted on this site. Such intellectual property remains the property of its respective owners, and any references here are made solely for identification or informational purposes, without implying any affiliation, endorsement, or partnership.
We make no representations or warranties, express or implied, regarding the accuracy, completeness, or suitability of any content or products presented. Nothing on this website should be construed as legal, tax, investment, financial, medical, or other professional advice. In addition, no part of this site—including articles or product references—constitutes a solicitation, recommendation, endorsement, advertisement, or offer to buy or sell any securities, franchises, or other financial instruments, particularly in jurisdictions where such activity would be unlawful.
All content is of a general nature and may not address the specific circumstances of any individual or entity. It is not a substitute for professional advice or services. Any actions you take based on the information provided here are strictly at your own risk. You accept full responsibility for any decisions or outcomes arising from your use of this website and agree to release us from any liability in connection with your use of, or reliance upon, the content or products found herein.