
|
Kaken Pharmaceutical Co., Ltd. (4521.T) Évaluation DCF |
Entièrement Modifiable: Adapté À Vos Besoins Dans Excel Ou Sheets
Conception Professionnelle: Modèles Fiables Et Conformes Aux Normes Du Secteur
Pré-Construits Pour Une Utilisation Rapide Et Efficace
Compatible MAC/PC, entièrement débloqué
Aucune Expertise N'Est Requise; Facile À Suivre
Kaken Pharmaceutical Co., Ltd. (4521.T) Bundle
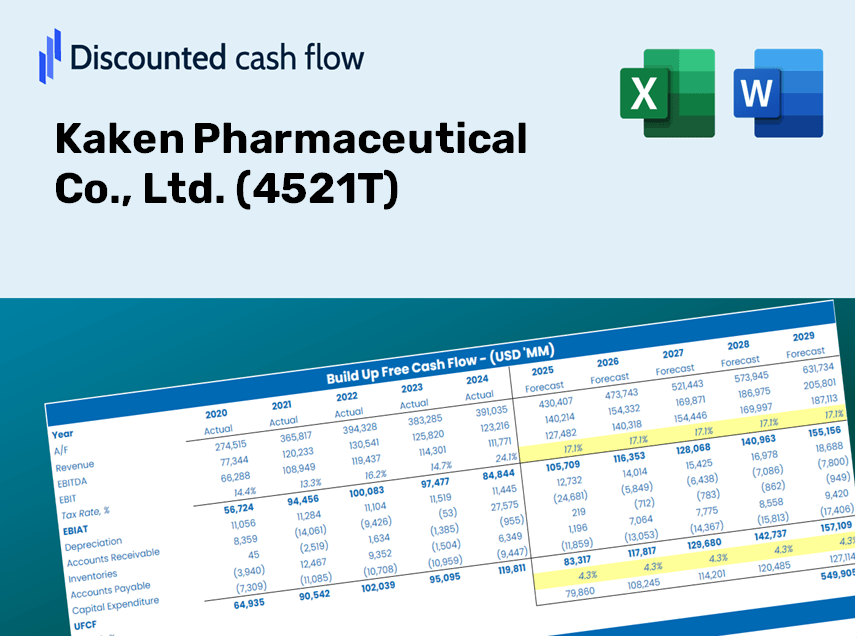
Gardez un aperçu de votre analyse d'évaluation de votre Kaken Pharmaceutical Co., Ltd. (4521T) à l'aide de notre calculatrice DCF de pointe! Préchargé avec des données réelles (4521T), ce modèle Excel vous permet d'ajuster les prévisions et les hypothèses pour déterminer avec précision la valeur intrinsèque de Kaken Pharmaceutical.
Discounted Cash Flow (DCF) - (USD MM)
| Year | AY1 2021 |
AY2 2022 |
AY3 2023 |
AY4 2024 |
AY5 2025 |
FY1 2026 |
FY2 2027 |
FY3 2028 |
FY4 2029 |
FY5 2030 |
|---|---|---|---|---|---|---|---|---|---|---|
| Revenue | 74,979.0 | 76,034.0 | 72,984.0 | 72,044.0 | 94,035.0 | 100,295.9 | 106,973.6 | 114,096.0 | 121,692.5 | 129,794.8 |
| Revenue Growth, % | 0 | 1.41 | -4.01 | -1.29 | 30.52 | 6.66 | 6.66 | 6.66 | 6.66 | 6.66 |
| EBITDA | 20,992.0 | 16,384.0 | 9,402.0 | 12,569.0 | 22,020.0 | 20,719.3 | 22,098.8 | 23,570.1 | 25,139.4 | 26,813.2 |
| EBITDA, % | 28 | 21.55 | 12.88 | 17.45 | 23.42 | 20.66 | 20.66 | 20.66 | 20.66 | 20.66 |
| Depreciation | 2,318.0 | 2,481.0 | 2,568.0 | 2,753.0 | 2,554.0 | 3,291.8 | 3,511.0 | 3,744.7 | 3,994.0 | 4,260.0 |
| Depreciation, % | 3.09 | 3.26 | 3.52 | 3.82 | 2.72 | 3.28 | 3.28 | 3.28 | 3.28 | 3.28 |
| EBIT | 18,674.0 | 13,903.0 | 6,834.0 | 9,816.0 | 19,466.0 | 17,427.5 | 18,587.8 | 19,825.4 | 21,145.4 | 22,553.3 |
| EBIT, % | 24.91 | 18.29 | 9.36 | 13.63 | 20.7 | 17.38 | 17.38 | 17.38 | 17.38 | 17.38 |
| Total Cash | 77,305.0 | 74,624.0 | 74,260.0 | 65,324.0 | 70,085.0 | 92,943.9 | 99,132.2 | 105,732.4 | 112,772.1 | 120,280.5 |
| Total Cash, percent | .0 | .0 | .0 | .0 | .0 | .0 | .0 | .0 | .0 | .0 |
| Account Receivables | 20,549.0 | 20,260.0 | 19,268.0 | 23,744.0 | 21,178.0 | 27,266.8 | 29,082.2 | 31,018.5 | 33,083.7 | 35,286.5 |
| Account Receivables, % | 27.41 | 26.65 | 26.4 | 32.96 | 22.52 | 27.19 | 27.19 | 27.19 | 27.19 | 27.19 |
| Inventories | 15,197.0 | 14,980.0 | 15,563.0 | 17,167.0 | 19,020.0 | 21,132.1 | 22,539.1 | 24,039.8 | 25,640.3 | 27,347.5 |
| Inventories, % | 20.27 | 19.7 | 21.32 | 23.83 | 20.23 | 21.07 | 21.07 | 21.07 | 21.07 | 21.07 |
| Accounts Payable | 8,569.0 | 5,939.0 | 6,130.0 | 7,099.0 | 8,322.0 | 9,295.9 | 9,914.8 | 10,574.9 | 11,279.0 | 12,030.0 |
| Accounts Payable, % | 11.43 | 7.81 | 8.4 | 9.85 | 8.85 | 9.27 | 9.27 | 9.27 | 9.27 | 9.27 |
| Capital Expenditure | -2,286.0 | -3,257.0 | -2,206.0 | -2,167.0 | -4,138.0 | -3,563.2 | -3,800.4 | -4,053.5 | -4,323.3 | -4,611.2 |
| Capital Expenditure, % | -3.05 | -4.28 | -3.02 | -3.01 | -4.4 | -3.55 | -3.55 | -3.55 | -3.55 | -3.55 |
| Tax Rate, % | 28.25 | 28.25 | 28.25 | 28.25 | 28.25 | 28.25 | 28.25 | 28.25 | 28.25 | 28.25 |
| EBITAT | 13,417.2 | 9,561.4 | 5,453.6 | 8,041.4 | 13,967.2 | 13,039.1 | 13,907.2 | 14,833.2 | 15,820.8 | 16,874.1 |
| Depreciation | ||||||||||
| Changes in Account Receivables | ||||||||||
| Changes in Inventories | ||||||||||
| Changes in Accounts Payable | ||||||||||
| Capital Expenditure | ||||||||||
| UFCF | -13,727.8 | 6,661.4 | 6,415.6 | 3,516.4 | 14,319.2 | 5,540.7 | 11,014.3 | 11,747.6 | 12,529.8 | 13,364.0 |
| WACC, % | 4.6 | 4.6 | 4.61 | 4.61 | 4.6 | 4.6 | 4.6 | 4.6 | 4.6 | 4.6 |
| PV UFCF | ||||||||||
| SUM PV UFCF | 46,763.0 | |||||||||
| Long Term Growth Rate, % | 2.00 | |||||||||
| Free cash flow (T + 1) | 13,631 | |||||||||
| Terminal Value | 523,538 | |||||||||
| Present Terminal Value | 418,036 | |||||||||
| Enterprise Value | 464,799 | |||||||||
| Net Debt | -50,243 | |||||||||
| Equity Value | 515,042 | |||||||||
| Diluted Shares Outstanding, MM | 38 | |||||||||
| Equity Value Per Share | 13,496.20 |
What You Will Receive
- Adjustable Forecast Inputs: Modify key assumptions (growth %, margins, WACC) effortlessly to generate various scenarios.
- Comprehensive Data: Kaken Pharmaceutical Co., Ltd. (4521T) financial data pre-loaded to facilitate your analysis.
- Automated DCF Results: The template calculates Net Present Value (NPV) and intrinsic value automatically.
- Customizable and Professional Design: A refined Excel model tailored to meet your valuation requirements.
- Designed for Analysts and Investors: Perfect for assessing projections, validating strategies, and enhancing efficiency.
Key Features
- Pre-Loaded Data: Kaken Pharmaceutical's historical financial statements and pre-filled forecasts.
- Fully Adjustable Inputs: Modify WACC, tax rates, revenue growth, and EBITDA margins as needed.
- Instant Results: Observe Kaken Pharmaceutical's intrinsic value recalculating in real-time.
- Clear Visual Outputs: Dashboard charts present valuation results and essential metrics.
- Built for Accuracy: A professional tool designed for analysts, investors, and finance specialists.
How It Operates
- Step 1: Download the prebuilt Excel template containing Kaken Pharmaceutical's data.
- Step 2: Review the completed sheets to familiarize yourself with essential metrics.
- Step 3: Modify forecasts and assumptions in the editable yellow cells (WACC, growth, margins).
- Step 4: Instantly observe the recalculated outcomes, including Kaken Pharmaceutical's intrinsic value.
- Step 5: Make well-informed investment choices or create reports based on the results.
Why Opt for This Calculator?
- Precise Data: Utilizes actual financial figures from Kaken Pharmaceutical Co., Ltd. to deliver trustworthy valuation outcomes.
- Tailorable: Modify critical variables such as growth rates, WACC, and tax rates to align with your forecasts.
- Efficient: Ready-to-use calculations mean you won't have to build from the ground up.
- Professional-Quality Tool: Crafted for investors, analysts, and consultants in the pharmaceutical sector.
- Easy to Use: Clear design and guided instructions ensure accessibility for all users.
Who Should Utilize This Product?
- Investors: Evaluate Kaken Pharmaceutical’s valuation prior to purchasing or selling stocks.
- CFOs and Financial Analysts: Optimize valuation workflows and assess financial projections.
- Startup Founders: Understand how prominent public companies like Kaken Pharmaceutical are appraised.
- Consultants: Create comprehensive valuation reports for clients.
- Students and Educators: Leverage real data to practice and instruct on valuation methodologies.
What the Template Includes
- Operating and Balance Sheet Data: Pre-filled historical data and forecasts for Kaken Pharmaceutical Co., Ltd. (4521T), encompassing revenue, EBITDA, EBIT, and capital expenditures.
- WACC Calculation: A dedicated sheet for the Weighted Average Cost of Capital (WACC), featuring parameters such as Beta, risk-free rate, and share price.
- DCF Valuation (Unlevered and Levered): Customizable Discounted Cash Flow models demonstrating intrinsic value with comprehensive calculations.
- Financial Statements: Pre-loaded annual and quarterly financial statements to facilitate in-depth analysis.
- Key Ratios: Includes profitability, leverage, and efficiency ratios specific to Kaken Pharmaceutical Co., Ltd. (4521T).
- Dashboard and Charts: A visual summary of valuation outputs and assumptions for straightforward results analysis.
Disclaimer
All information, articles, and product details provided on this website are for general informational and educational purposes only. We do not claim any ownership over, nor do we intend to infringe upon, any trademarks, copyrights, logos, brand names, or other intellectual property mentioned or depicted on this site. Such intellectual property remains the property of its respective owners, and any references here are made solely for identification or informational purposes, without implying any affiliation, endorsement, or partnership.
We make no representations or warranties, express or implied, regarding the accuracy, completeness, or suitability of any content or products presented. Nothing on this website should be construed as legal, tax, investment, financial, medical, or other professional advice. In addition, no part of this site—including articles or product references—constitutes a solicitation, recommendation, endorsement, advertisement, or offer to buy or sell any securities, franchises, or other financial instruments, particularly in jurisdictions where such activity would be unlawful.
All content is of a general nature and may not address the specific circumstances of any individual or entity. It is not a substitute for professional advice or services. Any actions you take based on the information provided here are strictly at your own risk. You accept full responsibility for any decisions or outcomes arising from your use of this website and agree to release us from any liability in connection with your use of, or reliance upon, the content or products found herein.