
|
Eisai Co., Ltd. (4523.T) Évaluation DCF |
Entièrement Modifiable: Adapté À Vos Besoins Dans Excel Ou Sheets
Conception Professionnelle: Modèles Fiables Et Conformes Aux Normes Du Secteur
Pré-Construits Pour Une Utilisation Rapide Et Efficace
Compatible MAC/PC, entièrement débloqué
Aucune Expertise N'Est Requise; Facile À Suivre
Eisai Co., Ltd. (4523.T) Bundle
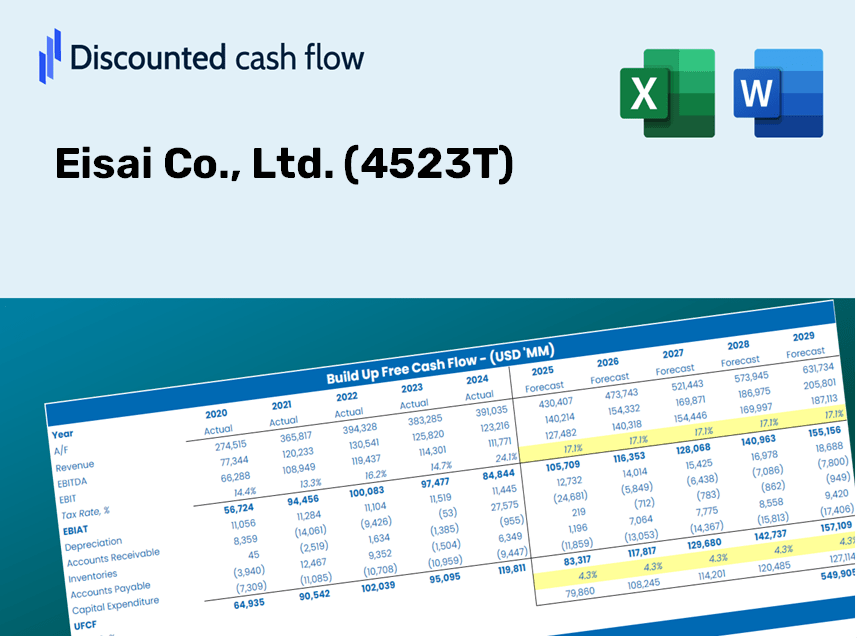
Gardez un aperçu de votre analyse d'évaluation de votre Eisai Co., Ltd. (4523T) à l'aide de notre calculatrice sophistiquée DCF! Équipé de données réelles (4523T), ce modèle Excel vous permet de modifier les prévisions et les hypothèses pour déterminer avec précision la valeur intrinsèque d'Eisai Co., Ltd.
Discounted Cash Flow (DCF) - (USD MM)
| Year | AY1 2021 |
AY2 2022 |
AY3 2023 |
AY4 2024 |
AY5 2025 |
FY1 2026 |
FY2 2027 |
FY3 2028 |
FY4 2029 |
FY5 2030 |
|---|---|---|---|---|---|---|---|---|---|---|
| Revenue | 645,942.0 | 756,226.0 | 744,402.0 | 741,751.0 | 789,400.0 | 831,983.3 | 876,863.6 | 924,165.0 | 974,018.0 | 1,026,560.3 |
| Revenue Growth, % | 0 | 17.07 | -1.56 | -0.35612 | 6.42 | 5.39 | 5.39 | 5.39 | 5.39 | 5.39 |
| EBITDA | 90,046.0 | 94,551.0 | 87,257.0 | 103,106.0 | 104,490.0 | 108,660.4 | 114,521.9 | 120,699.7 | 127,210.7 | 134,072.9 |
| EBITDA, % | 13.94 | 12.5 | 11.72 | 13.9 | 13.24 | 13.06 | 13.06 | 13.06 | 13.06 | 13.06 |
| Depreciation | 36,299.0 | 38,398.0 | 39,981.0 | 39,398.0 | 39,906.0 | 43,986.5 | 46,359.3 | 48,860.1 | 51,495.8 | 54,273.7 |
| Depreciation, % | 5.62 | 5.08 | 5.37 | 5.31 | 5.06 | 5.29 | 5.29 | 5.29 | 5.29 | 5.29 |
| EBIT | 53,747.0 | 56,153.0 | 47,276.0 | 63,708.0 | 64,584.0 | 64,673.9 | 68,162.6 | 71,839.6 | 75,714.9 | 79,799.2 |
| EBIT, % | 8.32 | 7.43 | 6.35 | 8.59 | 8.18 | 7.77 | 7.77 | 7.77 | 7.77 | 7.77 |
| Total Cash | 249,007.0 | 310,065.0 | 267,890.0 | 305,123.0 | 265,561.0 | 316,677.3 | 333,760.1 | 351,764.4 | 370,739.9 | 390,739.1 |
| Total Cash, percent | .0 | .0 | .0 | .0 | .0 | .0 | .0 | .0 | .0 | .0 |
| Account Receivables | 160,310.0 | 207,950.0 | 187,256.0 | 217,208.0 | 220,022.0 | 224,014.5 | 236,098.7 | 248,834.8 | 262,257.9 | 276,405.1 |
| Account Receivables, % | 24.82 | 27.5 | 25.16 | 29.28 | 27.87 | 26.93 | 26.93 | 26.93 | 26.93 | 26.93 |
| Inventories | 85,118.0 | 99,008.0 | 140,417.0 | 174,651.0 | 215,905.0 | 159,789.2 | 168,408.8 | 177,493.4 | 187,068.1 | 197,159.3 |
| Inventories, % | 13.18 | 13.09 | 18.86 | 23.55 | 27.35 | 19.21 | 19.21 | 19.21 | 19.21 | 19.21 |
| Accounts Payable | 94,548.0 | 108,065.0 | 86,826.0 | 23,958.0 | 91,571.0 | 92,218.9 | 97,193.5 | 102,436.5 | 107,962.4 | 113,786.3 |
| Accounts Payable, % | 14.64 | 14.29 | 11.66 | 3.23 | 11.6 | 11.08 | 11.08 | 11.08 | 11.08 | 11.08 |
| Capital Expenditure | -38,144.0 | -40,467.0 | -34,559.0 | -24,823.0 | -11,933.0 | -34,539.1 | -36,402.2 | -38,365.9 | -40,435.5 | -42,616.8 |
| Capital Expenditure, % | -5.91 | -5.35 | -4.64 | -3.35 | -1.51 | -4.15 | -4.15 | -4.15 | -4.15 | -4.15 |
| Tax Rate, % | 23.96 | 23.96 | 23.96 | 23.96 | 23.96 | 23.96 | 23.96 | 23.96 | 23.96 | 23.96 |
| EBITAT | 42,896.6 | 49,446.6 | 58,220.1 | 43,700.0 | 49,108.8 | 53,356.2 | 56,234.4 | 59,267.9 | 62,465.0 | 65,834.6 |
| Depreciation | ||||||||||
| Changes in Account Receivables | ||||||||||
| Changes in Inventories | ||||||||||
| Changes in Accounts Payable | ||||||||||
| Capital Expenditure | ||||||||||
| UFCF | -109,828.4 | -635.4 | 21,688.1 | -68,779.0 | 100,626.8 | 115,574.8 | 50,462.3 | 53,184.4 | 56,053.4 | 59,077.1 |
| WACC, % | 4.32 | 4.36 | 4.41 | 4.27 | 4.3 | 4.33 | 4.33 | 4.33 | 4.33 | 4.33 |
| PV UFCF | ||||||||||
| SUM PV UFCF | 299,048.9 | |||||||||
| Long Term Growth Rate, % | 4.00 | |||||||||
| Free cash flow (T + 1) | 61,440 | |||||||||
| Terminal Value | 18,403,467 | |||||||||
| Present Terminal Value | 14,885,844 | |||||||||
| Enterprise Value | 15,184,892 | |||||||||
| Net Debt | -78,038 | |||||||||
| Equity Value | 15,262,930 | |||||||||
| Diluted Shares Outstanding, MM | 284 | |||||||||
| Equity Value Per Share | 53,831.42 |
Your Benefits with Eisai Co., Ltd. (4523T)
- Authentic Eisai Data: Comprehensive financial information – from revenue to EBIT – based on verified and forecasted figures.
- Complete Customization: Modify all essential parameters (highlighted cells) such as WACC, growth rates, and tax percentages.
- Real-Time Valuation Adjustments: Automatic recalculations to evaluate the effects of modifications on Eisai's fair value.
- Flexible Excel Template: Designed for easy edits, scenario analysis, and precise projections.
- Efficient and Reliable: Eliminate the need to construct models from the ground up while ensuring accuracy and adaptability.
Distinctive Features of Eisai Co., Ltd. (4523T)
- Customizable Financial Metrics: Adjust essential elements such as revenue growth rates, EBITDA percentages, and capital spending.
- Instant DCF Valuation: Automatically calculates intrinsic value, net present value (NPV), and additional financial outputs.
- High Precision Estimates: Leverages Eisai's actual financial data for reliable valuation results.
- Streamlined Scenario Analysis: Easily assess various assumptions and evaluate different outcomes.
- Efficient Valuation Solution: Remove the necessity to construct intricate valuation models from the ground up.
How It Works
- Step 1: Download the Excel file for Eisai Co., Ltd. (4523T).
- Step 2: Review Eisai's pre-filled financial data and projections.
- Step 3: Adjust key inputs such as revenue growth, WACC, and tax rates (highlighted cells).
- Step 4: Observe the DCF model update in real-time as you modify your assumptions.
- Step 5: Evaluate the results and apply the findings to your investment strategy.
Why Select This Calculator for Eisai Co., Ltd. (4523T)?
- All-in-One Solution: Combines DCF, WACC, and financial ratio analyses for comprehensive evaluations.
- Flexible Inputs: Modify the yellow-highlighted fields to explore different financial scenarios.
- In-Depth Analysis: Automatically computes Eisai's intrinsic value and Net Present Value.
- Integrated Data: Includes historical and projected data for precise analysis.
- Expert Standard: Perfect for financial analysts, investors, and business advisors focused on Eisai Co., Ltd.
Who Can Benefit from This Product?
- Individual Investors: Make well-informed choices regarding the purchase or sale of Eisai Co., Ltd. (4523T) stock.
- Financial Analysts: Enhance your valuation methodologies with ready-to-implement financial models for Eisai Co., Ltd. (4523T).
- Consultants: Provide clients with precise and timely valuation insights related to Eisai Co., Ltd. (4523T).
- Business Owners: Gain insights into how major companies like Eisai Co., Ltd. (4523T) are valued to inform your own business strategy.
- Finance Students: Master valuation techniques using case studies and data from Eisai Co., Ltd. (4523T).
Contents of the Template
- Pre-Filled DCF Model: Eisai Co., Ltd. (4523T)’s financial data ready for immediate application.
- WACC Calculator: Comprehensive calculations for the Weighted Average Cost of Capital.
- Financial Ratios: Assess Eisai’s profitability, leverage, and operational efficiency.
- Editable Inputs: Adjust assumptions such as growth rates, margins, and CAPEX to suit your analysis.
- Financial Statements: Access annual and quarterly reports for in-depth evaluation.
- Interactive Dashboard: Effortlessly visualize essential valuation metrics and outcomes.
Disclaimer
All information, articles, and product details provided on this website are for general informational and educational purposes only. We do not claim any ownership over, nor do we intend to infringe upon, any trademarks, copyrights, logos, brand names, or other intellectual property mentioned or depicted on this site. Such intellectual property remains the property of its respective owners, and any references here are made solely for identification or informational purposes, without implying any affiliation, endorsement, or partnership.
We make no representations or warranties, express or implied, regarding the accuracy, completeness, or suitability of any content or products presented. Nothing on this website should be construed as legal, tax, investment, financial, medical, or other professional advice. In addition, no part of this site—including articles or product references—constitutes a solicitation, recommendation, endorsement, advertisement, or offer to buy or sell any securities, franchises, or other financial instruments, particularly in jurisdictions where such activity would be unlawful.
All content is of a general nature and may not address the specific circumstances of any individual or entity. It is not a substitute for professional advice or services. Any actions you take based on the information provided here are strictly at your own risk. You accept full responsibility for any decisions or outcomes arising from your use of this website and agree to release us from any liability in connection with your use of, or reliance upon, the content or products found herein.