
|
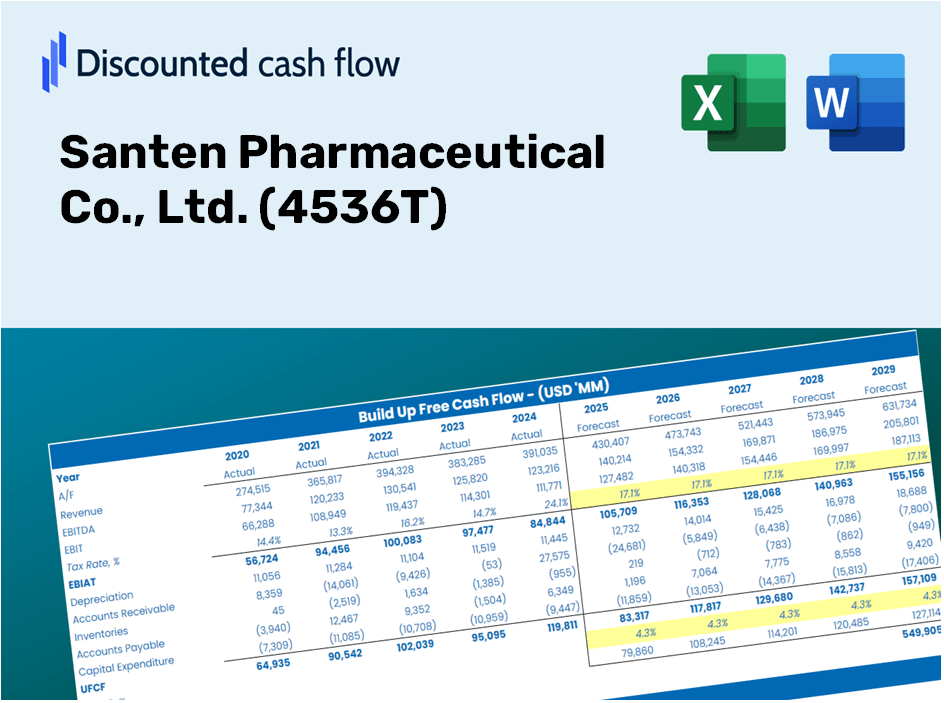
Santen Pharmaceutical Co., Ltd. (4536.T) Évaluation DCF |
Entièrement Modifiable: Adapté À Vos Besoins Dans Excel Ou Sheets
Conception Professionnelle: Modèles Fiables Et Conformes Aux Normes Du Secteur
Pré-Construits Pour Une Utilisation Rapide Et Efficace
Compatible MAC/PC, entièrement débloqué
Aucune Expertise N'Est Requise; Facile À Suivre
Santen Pharmaceutical Co., Ltd. (4536.T) Bundle
Vous cherchez à évaluer la valeur intrinsèque de Santen Pharmaceutical Co., Ltd.? Notre (4536T) Calculator DCF fusionne les données réelles avec des fonctionnalités de personnalisation approfondies, vous permettant d'affiner vos prévisions et d'améliorer vos décisions d'investissement.
Discounted Cash Flow (DCF) - (USD MM)
| Year | AY1 2021 |
AY2 2022 |
AY3 2023 |
AY4 2024 |
AY5 2025 |
FY1 2026 |
FY2 2027 |
FY3 2028 |
FY4 2029 |
FY5 2030 |
|---|---|---|---|---|---|---|---|---|---|---|
| Revenue | 249,605.0 | 266,257.0 | 279,037.0 | 301,965.0 | 300,004.0 | 314,283.2 | 329,242.0 | 344,912.8 | 361,329.4 | 378,527.5 |
| Revenue Growth, % | 0 | 6.67 | 4.8 | 8.22 | -0.64941 | 4.76 | 4.76 | 4.76 | 4.76 | 4.76 |
| EBITDA | 30,007.0 | 54,524.0 | 14,298.0 | 56,457.0 | 68,830.0 | 49,822.3 | 52,193.7 | 54,677.9 | 57,280.4 | 60,006.7 |
| EBITDA, % | 12.02 | 20.48 | 5.12 | 18.7 | 22.94 | 15.85 | 15.85 | 15.85 | 15.85 | 15.85 |
| Depreciation | 17,922.0 | 17,055.0 | 17,249.0 | 18,178.0 | 17,948.0 | 19,969.4 | 20,919.8 | 21,915.6 | 22,958.7 | 24,051.4 |
| Depreciation, % | 7.18 | 6.41 | 6.18 | 6.02 | 5.98 | 6.35 | 6.35 | 6.35 | 6.35 | 6.35 |
| EBIT | 12,085.0 | 37,469.0 | -2,951.0 | 38,279.0 | 50,882.0 | 29,852.9 | 31,273.8 | 32,762.3 | 34,321.7 | 35,955.3 |
| EBIT, % | 4.84 | 14.07 | -1.06 | 12.68 | 16.96 | 9.5 | 9.5 | 9.5 | 9.5 | 9.5 |
| Total Cash | 63,415.0 | 84,307.0 | 58,677.0 | 94,961.0 | 92,997.0 | 88,341.6 | 92,546.3 | 96,951.2 | 101,565.8 | 106,400.0 |
| Total Cash, percent | .0 | .0 | .0 | .0 | .0 | .0 | .0 | .0 | .0 | .0 |
| Account Receivables | 95,992.0 | 99,591.0 | 107,165.0 | 90,539.0 | 72,083.0 | 105,773.6 | 110,808.1 | 116,082.2 | 121,607.3 | 127,395.4 |
| Account Receivables, % | 38.46 | 37.4 | 38.41 | 29.98 | 24.03 | 33.66 | 33.66 | 33.66 | 33.66 | 33.66 |
| Inventories | 41,575.0 | 37,141.0 | 39,352.0 | 43,185.0 | 51,590.0 | 47,900.6 | 50,180.5 | 52,569.0 | 55,071.1 | 57,692.3 |
| Inventories, % | 16.66 | 13.95 | 14.1 | 14.3 | 17.2 | 15.24 | 15.24 | 15.24 | 15.24 | 15.24 |
| Accounts Payable | 24,259.0 | 24,420.0 | 25,282.0 | 24,042.0 | 38,989.0 | 30,742.6 | 32,205.8 | 33,738.7 | 35,344.5 | 37,026.8 |
| Accounts Payable, % | 9.72 | 9.17 | 9.06 | 7.96 | 13 | 9.78 | 9.78 | 9.78 | 9.78 | 9.78 |
| Capital Expenditure | -23,804.0 | -35,841.0 | -24,588.0 | -10,687.0 | -6,662.0 | -23,614.8 | -24,738.7 | -25,916.2 | -27,149.7 | -28,442.0 |
| Capital Expenditure, % | -9.54 | -13.46 | -8.81 | -3.54 | -2.22 | -7.51 | -7.51 | -7.51 | -7.51 | -7.51 |
| Tax Rate, % | 24.75 | 24.75 | 24.75 | 24.75 | 24.75 | 24.75 | 24.75 | 24.75 | 24.75 | 24.75 |
| EBITAT | 9,627.3 | 28,634.1 | -7,606.8 | 34,137.7 | 38,290.9 | 25,107.4 | 26,302.5 | 27,554.4 | 28,865.9 | 30,239.8 |
| Depreciation | ||||||||||
| Changes in Account Receivables | ||||||||||
| Changes in Inventories | ||||||||||
| Changes in Accounts Payable | ||||||||||
| Capital Expenditure | ||||||||||
| UFCF | -109,562.7 | 10,844.1 | -23,868.8 | 53,181.7 | 74,574.9 | -16,785.6 | 16,632.4 | 17,424.1 | 18,253.4 | 19,122.2 |
| WACC, % | 4.64 | 4.63 | 4.74 | 4.69 | 4.62 | 4.66 | 4.66 | 4.66 | 4.66 | 4.66 |
| PV UFCF | ||||||||||
| SUM PV UFCF | 44,776.7 | |||||||||
| Long Term Growth Rate, % | 3.00 | |||||||||
| Free cash flow (T + 1) | 19,696 | |||||||||
| Terminal Value | 1,183,069 | |||||||||
| Present Terminal Value | 941,904 | |||||||||
| Enterprise Value | 986,680 | |||||||||
| Net Debt | -92,997 | |||||||||
| Equity Value | 1,079,677 | |||||||||
| Diluted Shares Outstanding, MM | 350 | |||||||||
| Equity Value Per Share | 3,087.49 |
What You'll Receive
- Customizable Excel Template: A fully adjustable Excel-based DCF Calculator featuring pre-filled real Santen Pharmaceutical Co., Ltd. (4536T) financials.
- Authentic Data: Historical figures and forward-looking projections (as indicated in the yellow cells).
- Forecasting Flexibility: Adjust forecast assumptions such as revenue growth, EBITDA %, and WACC.
- Instant Calculations: Quickly view how your inputs affect Santen Pharmaceutical Co., Ltd. (4536T)'s valuation.
- Professional Resource: Designed for investors, CFOs, consultants, and financial analysts.
- User-Centric Design: Organized for clarity and ease of navigation, complete with step-by-step guidance.
Key Features
- 🔍 Real-Life Santen Financials: Pre-filled historical and projected data for Santen Pharmaceutical Co., Ltd. (4536T).
- ✏️ Fully Customizable Inputs: Modify all essential parameters (yellow cells) such as WACC, growth %, and tax rates.
- 📊 Professional DCF Valuation: Integrated formulas assess Santen’s intrinsic value using the Discounted Cash Flow methodology.
- ⚡ Instant Results: Get immediate visualizations of Santen’s valuation after making any adjustments.
- Scenario Analysis: Evaluate and contrast outcomes for different financial assumptions side-by-side.
How It Works
- Download: Obtain the pre-formatted Excel file containing Santen Pharmaceutical Co., Ltd.'s (4536T) financial data.
- Customize: Modify projections, such as revenue growth rates, EBITDA percentages, and WACC.
- Update Automatically: Watch intrinsic value and NPV calculations refresh in real-time.
- Test Scenarios: Develop various forecasts and instantly compare the results.
- Make Decisions: Leverage the valuation outcomes to inform your investment strategy.
Why Opt for This Calculator?
- Designed for Experts: A sophisticated tool trusted by analysts, CFOs, and industry consultants.
- Accurate Data: Santen Pharmaceutical's historical and projected financials are preloaded for precision.
- Scenario Analysis: Effortlessly simulate various forecasts and assumptions.
- Comprehensive Results: Instantly calculates intrinsic value, NPV, and essential metrics.
- User-Friendly: Step-by-step guidance helps you navigate the process easily.
Who Can Benefit from Santen Pharmaceutical Co., Ltd. (4536T)?
- Investors: Gain insights into investment decisions with our advanced valuation tools.
- Financial Analysts: Enhance efficiency with a customizable DCF model tailored for pharmaceutical evaluations.
- Consultants: Effortlessly modify templates for impactful client presentations or detailed reports.
- Pharmaceutical Enthusiasts: Expand your knowledge of valuation methodologies through practical, industry-specific examples.
- Educators and Students: Utilize this resource as a hands-on learning aid in pharmaceutical finance courses.
Contents of the Template
- Pre-Filled Data: Contains Santen Pharmaceutical’s historical financial performance and future projections.
- Discounted Cash Flow Model: An editable DCF valuation model with automated calculations.
- Weighted Average Cost of Capital (WACC): A specific sheet for computing WACC based on tailored inputs.
- Key Financial Ratios: Evaluate Santen Pharmaceutical’s profitability, efficiency, and financial leverage.
- Customizable Inputs: Easily modify revenue growth rates, margins, and tax rates.
- User-Friendly Dashboard: Visual representations and tables summarizing essential valuation findings.
Disclaimer
All information, articles, and product details provided on this website are for general informational and educational purposes only. We do not claim any ownership over, nor do we intend to infringe upon, any trademarks, copyrights, logos, brand names, or other intellectual property mentioned or depicted on this site. Such intellectual property remains the property of its respective owners, and any references here are made solely for identification or informational purposes, without implying any affiliation, endorsement, or partnership.
We make no representations or warranties, express or implied, regarding the accuracy, completeness, or suitability of any content or products presented. Nothing on this website should be construed as legal, tax, investment, financial, medical, or other professional advice. In addition, no part of this site—including articles or product references—constitutes a solicitation, recommendation, endorsement, advertisement, or offer to buy or sell any securities, franchises, or other financial instruments, particularly in jurisdictions where such activity would be unlawful.
All content is of a general nature and may not address the specific circumstances of any individual or entity. It is not a substitute for professional advice or services. Any actions you take based on the information provided here are strictly at your own risk. You accept full responsibility for any decisions or outcomes arising from your use of this website and agree to release us from any liability in connection with your use of, or reliance upon, the content or products found herein.