
|
Peptidream Inc. (4587.T) Évaluation DCF |
Entièrement Modifiable: Adapté À Vos Besoins Dans Excel Ou Sheets
Conception Professionnelle: Modèles Fiables Et Conformes Aux Normes Du Secteur
Pré-Construits Pour Une Utilisation Rapide Et Efficace
Compatible MAC/PC, entièrement débloqué
Aucune Expertise N'Est Requise; Facile À Suivre
PeptiDream Inc. (4587.T) Bundle
Découvrez le véritable potentiel de Peptidream Inc. (4587T) avec notre calculatrice avancée DCF! Ajustez les hypothèses cruciales, explorez divers scénarios et évaluez comment les changements influencent Peptidream Inc. (4587T) - le tout dans un modèle Excel complet.
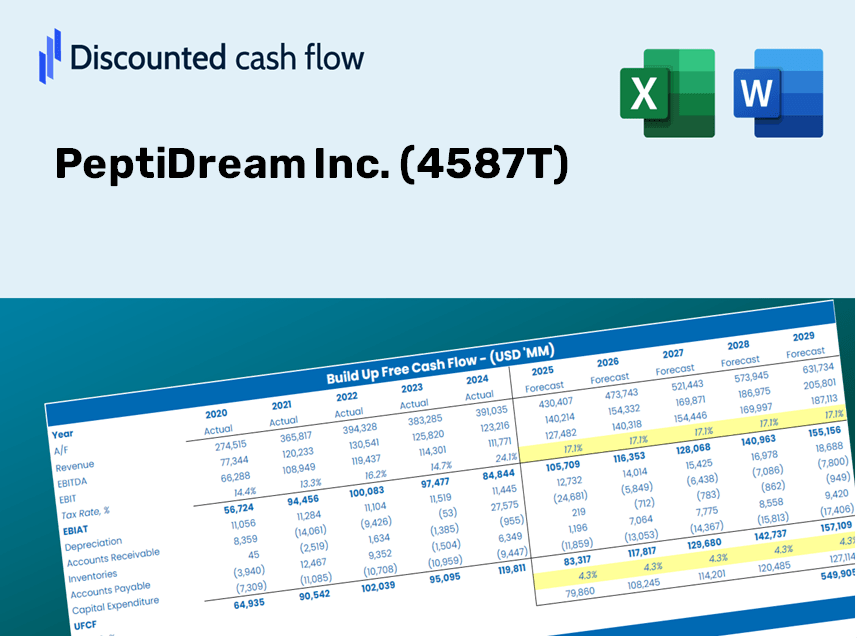
Discounted Cash Flow (DCF) - (USD MM)
| Year | AY1 2020 |
AY2 2021 |
AY3 2022 |
AY4 2023 |
AY5 2024 |
FY1 2025 |
FY2 2026 |
FY3 2027 |
FY4 2028 |
FY5 2029 |
|---|---|---|---|---|---|---|---|---|---|---|
| Revenue | 11,677.3 | 9,422.2 | 26,852.4 | 28,712.2 | 46,676.5 | 64,201.4 | 88,306.0 | 121,460.8 | 167,063.7 | 229,788.3 |
| Revenue Growth, % | 0 | -19.31 | 184.99 | 6.93 | 62.57 | 37.55 | 37.55 | 37.55 | 37.55 | 37.55 |
| EBITDA | 7,562.3 | 5,009.2 | 9,020.1 | 7,376.1 | 23,362.4 | 29,180.4 | 40,136.4 | 55,205.7 | 75,932.8 | 104,442.1 |
| EBITDA, % | 64.76 | 53.16 | 33.59 | 25.69 | 50.05 | 45.45 | 45.45 | 45.45 | 45.45 | 45.45 |
| Depreciation | 571.0 | 633.0 | 1,973.4 | 2,433.2 | 2,248.5 | 4,140.8 | 5,695.5 | 7,833.9 | 10,775.2 | 14,820.8 |
| Depreciation, % | 4.89 | 6.72 | 7.35 | 8.47 | 4.82 | 6.45 | 6.45 | 6.45 | 6.45 | 6.45 |
| EBIT | 6,991.3 | 4,376.1 | 7,046.7 | 4,942.9 | 21,113.9 | 25,039.6 | 34,440.8 | 47,371.8 | 65,157.7 | 89,621.3 |
| EBIT, % | 59.87 | 46.45 | 26.24 | 17.22 | 45.23 | 39 | 39 | 39 | 39 | 39 |
| Total Cash | 7,149.4 | 11,746.5 | 5,253.9 | 19,514.1 | 48,124.2 | 44,781.1 | 61,594.3 | 84,720.1 | 116,528.6 | 160,279.7 |
| Total Cash, percent | .0 | .0 | .0 | .0 | .0 | .0 | .0 | .0 | .0 | .0 |
| Account Receivables | 7,530.6 | 873.6 | 16,589.1 | 4,970.0 | 5,282.9 | 21,079.6 | 28,994.0 | 39,880.0 | 54,853.0 | 75,447.8 |
| Account Receivables, % | 64.49 | 9.27 | 61.78 | 17.31 | 11.32 | 32.83 | 32.83 | 32.83 | 32.83 | 32.83 |
| Inventories | 586.0 | 925.1 | 2,678.7 | 2,404.2 | 2,671.7 | 4,996.1 | 6,871.9 | 9,452.0 | 13,000.7 | 17,881.9 |
| Inventories, % | 5.02 | 9.82 | 9.98 | 8.37 | 5.72 | 7.78 | 7.78 | 7.78 | 7.78 | 7.78 |
| Accounts Payable | 55.3 | 100.9 | 4,080.1 | 3,203.0 | 5,332.0 | 5,048.5 | 6,943.9 | 9,551.0 | 13,137.0 | 18,069.3 |
| Accounts Payable, % | 0.47336 | 1.07 | 15.19 | 11.16 | 11.42 | 7.86 | 7.86 | 7.86 | 7.86 | 7.86 |
| Capital Expenditure | -586.3 | -1,214.7 | -3,975.4 | -1,369.0 | -2,076.5 | -5,384.4 | -7,405.9 | -10,186.5 | -14,011.1 | -19,271.6 |
| Capital Expenditure, % | -5.02 | -12.89 | -14.8 | -4.77 | -4.45 | -8.39 | -8.39 | -8.39 | -8.39 | -8.39 |
| Tax Rate, % | 28.12 | 28.12 | 28.12 | 28.12 | 28.12 | 28.12 | 28.12 | 28.12 | 28.12 | 28.12 |
| EBITAT | 5,166.1 | 2,960.4 | 8,001.0 | 3,446.8 | 15,176.8 | 19,188.2 | 26,392.4 | 36,301.6 | 49,931.1 | 68,677.9 |
| Depreciation | ||||||||||
| Changes in Account Receivables | ||||||||||
| Changes in Inventories | ||||||||||
| Changes in Accounts Payable | ||||||||||
| Capital Expenditure | ||||||||||
| UFCF | -2,910.5 | 8,742.2 | -7,490.9 | 15,527.7 | 16,897.4 | -460.1 | 16,787.2 | 23,090.1 | 31,759.3 | 43,683.5 |
| WACC, % | 4.48 | 4.46 | 4.57 | 4.47 | 4.48 | 4.49 | 4.49 | 4.49 | 4.49 | 4.49 |
| PV UFCF | ||||||||||
| SUM PV UFCF | 96,873.9 | |||||||||
| Long Term Growth Rate, % | 3.50 | |||||||||
| Free cash flow (T + 1) | 45,212 | |||||||||
| Terminal Value | 4,549,151 | |||||||||
| Present Terminal Value | 3,651,543 | |||||||||
| Enterprise Value | 3,748,416 | |||||||||
| Net Debt | -28,483 | |||||||||
| Equity Value | 3,776,900 | |||||||||
| Diluted Shares Outstanding, MM | 130 | |||||||||
| Equity Value Per Share | 29,099.40 |
What You Will Receive
- Customizable Excel Template: A fully editable Excel-based DCF Calculator featuring pre-loaded financials for PeptiDream Inc. (4587T).
- Real Data Insights: Access to historical data and forward-looking estimates (highlighted in the yellow cells).
- Flexible Forecasting: Adjust key forecast parameters such as revenue growth, EBITDA %, and WACC.
- Instant Calculations: Quickly visualize how your inputs affect the valuation of PeptiDream Inc. (4587T).
- Professional Resource: Designed for investors, CFOs, consultants, and financial analysts.
- User-Friendly Layout: Organized for clarity and simplicity, complete with step-by-step guidance.
Core Capabilities
- Customizable Forecast Inputs: Adjust essential metrics such as revenue projections, EBITDA percentages, and capital investments.
- Instant DCF Valuation: Quickly derives intrinsic value, NPV, and additional outputs automatically.
- High-Precision Accuracy: Leverages PeptiDream Inc.’s (4587T) actual financial data for accurate valuation results.
- Simplified Scenario Analysis: Effortlessly evaluate various assumptions and analyze outcomes.
- Efficiency Booster: Remove the hassle of constructing intricate valuation models from the ground up.
How It Works
- Step 1: Download the prebuilt Excel template containing PeptiDream Inc.'s (4587T) data.
- Step 2: Review the pre-filled sheets to familiarize yourself with the key metrics.
- Step 3: Update forecasts and assumptions in the editable yellow cells (WACC, growth, margins).
- Step 4: Instantly view recalculated results, including PeptiDream Inc.'s (4587T) intrinsic value.
- Step 5: Make informed investment decisions or create reports utilizing the outputs.
Why Opt for the PeptiDream Inc. (4587T) Calculator?
- Time-Efficient: Skip the hassle of building a valuation model from the ground up – it’s fully operational.
- Enhanced Accuracy: Utilize dependable financial data and formulas to minimize valuation errors.
- Completely Modular: Adapt the model to suit your specific assumptions and forecasts.
- Simple to Understand: Intuitive charts and outputs facilitate straightforward analysis of results.
- Endorsed by Professionals: Crafted for experts who prioritize precision and user-friendliness.
Who Should Consider PeptiDream Inc. (4587T)?
- Professional Investors: Develop comprehensive and trustworthy valuation models for portfolio assessments.
- Corporate Finance Teams: Examine valuation scenarios to inform strategic decision-making.
- Consultants and Advisors: Equip clients with precise valuation insights for PeptiDream Inc. (4587T).
- Students and Educators: Leverage real-world data to enhance financial modeling practices and education.
- Biotech Enthusiasts: Gain insights into how biotech firms like PeptiDream Inc. (4587T) are appraised in the market.
Contents of the Template
- Pre-Populated Data: Features PeptiDream Inc.'s historical financial information and projections.
- Discounted Cash Flow Model: An editable DCF valuation model with automatic computational features.
- Weighted Average Cost of Capital (WACC): A specific sheet dedicated to WACC calculations using user-defined inputs.
- Key Financial Ratios: Assess the profitability, efficiency, and leverage of PeptiDream Inc.
- Customizable Inputs: Easily modify revenue growth, profit margins, and tax rates.
- User-Friendly Dashboard: Visuals and tables that encapsulate essential valuation outcomes.
Disclaimer
All information, articles, and product details provided on this website are for general informational and educational purposes only. We do not claim any ownership over, nor do we intend to infringe upon, any trademarks, copyrights, logos, brand names, or other intellectual property mentioned or depicted on this site. Such intellectual property remains the property of its respective owners, and any references here are made solely for identification or informational purposes, without implying any affiliation, endorsement, or partnership.
We make no representations or warranties, express or implied, regarding the accuracy, completeness, or suitability of any content or products presented. Nothing on this website should be construed as legal, tax, investment, financial, medical, or other professional advice. In addition, no part of this site—including articles or product references—constitutes a solicitation, recommendation, endorsement, advertisement, or offer to buy or sell any securities, franchises, or other financial instruments, particularly in jurisdictions where such activity would be unlawful.
All content is of a general nature and may not address the specific circumstances of any individual or entity. It is not a substitute for professional advice or services. Any actions you take based on the information provided here are strictly at your own risk. You accept full responsibility for any decisions or outcomes arising from your use of this website and agree to release us from any liability in connection with your use of, or reliance upon, the content or products found herein.