
|
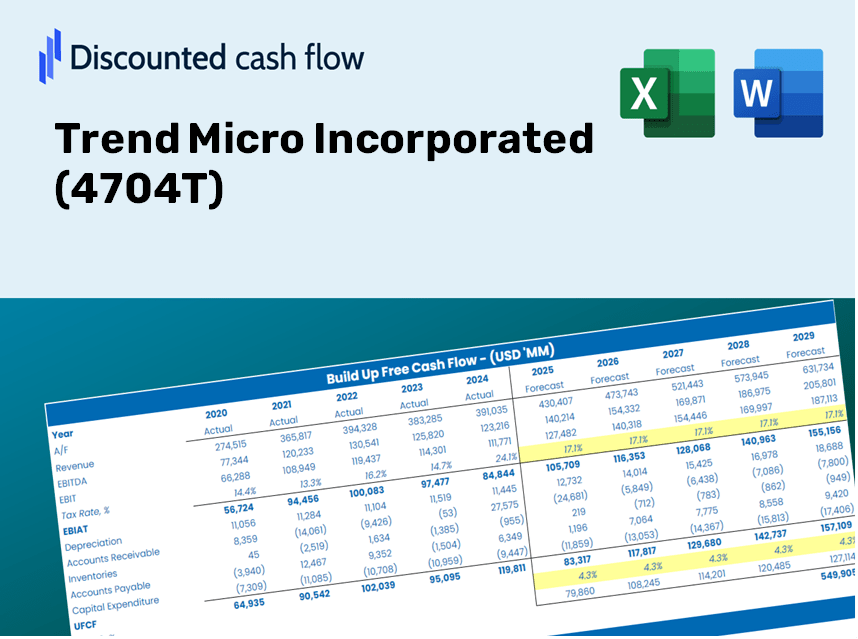
Trend Micro Incorporated (4704.T) Évaluation DCF |
Entièrement Modifiable: Adapté À Vos Besoins Dans Excel Ou Sheets
Conception Professionnelle: Modèles Fiables Et Conformes Aux Normes Du Secteur
Pré-Construits Pour Une Utilisation Rapide Et Efficace
Compatible MAC/PC, entièrement débloqué
Aucune Expertise N'Est Requise; Facile À Suivre
Trend Micro Incorporated (4704.T) Bundle
Gagnez de la maîtrise sur votre analyse d'évaluation de votre micro incorporé (4704T) à l'aide de notre calculatrice sophistiquée DCF! Avec des données réelles intégrées (4704T), ce modèle Excel vous permet d'ajuster les prévisions et les hypothèses, permettant des calculs précis de la valeur intrinsèque de Trend Micro Incorporated.
What You'll Receive
- Authentic Trend Micro Financial Data: Pre-filled with Trend Micro’s historical and forecasted data for thorough analysis.
- Completely Customizable Template: Easily adjust key metrics such as revenue growth, WACC, and EBITDA percentage.
- Instant Calculations: Observe the intrinsic value for Trend Micro update immediately as you make adjustments.
- Expert Valuation Tool: Tailored for investors, analysts, and consultants in need of precise DCF outcomes.
- Intuitive Design: Organized layout and straightforward instructions suitable for all skill levels.
Key Features
- Pre-Loaded Data: Trend Micro's historical financial statements and pre-filled forecasts.
- Fully Adjustable Inputs: Customize WACC, tax rates, revenue growth, and EBITDA margins.
- Instant Results: View Trend Micro’s intrinsic value updated in real time.
- Clear Visual Outputs: Dashboard charts illustrate valuation results and essential metrics.
- Built for Accuracy: A professional tool tailored for analysts, investors, and finance professionals.
How It Functions
- Step 1: Download the Excel file.
- Step 2: Examine Trend Micro's pre-filled financial figures and projections.
- Step 3: Adjust key inputs such as revenue growth, WACC, and tax rates (highlighted cells).
- Step 4: Observe the DCF model update in real-time as you make adjustments.
- Step 5: Review the results and utilize them for your investment strategies.
Why Choose This Calculator for Trend Micro Incorporated (4704T)?
- Accurate Data: Current financial information from Trend Micro guarantees trustworthy valuation outcomes.
- Customizable: Tailor essential variables such as growth rates, WACC, and tax rates to fit your forecasts.
- Time-Saving: Ready-made calculations save you the hassle of starting from the ground up.
- Professional-Grade Tool: Crafted for the needs of investors, analysts, and consultants.
- User-Friendly: Clear layout and step-by-step guidance ensure ease of use for everyone.
Who Can Benefit from This Product?
- Professional Investors: Create comprehensive and trustworthy valuation models for portfolio assessments related to Trend Micro Incorporated (4704T).
- Corporate Finance Teams: Evaluate valuation scenarios to inform strategic decisions within their organization.
- Consultants and Advisors: Deliver precise valuation insights to clients regarding Trend Micro Incorporated (4704T) stock.
- Students and Educators: Leverage real data to enhance learning and practice in financial modeling.
- Tech Enthusiasts: Gain insights into how tech firms like Trend Micro Incorporated (4704T) are valued in the marketplace.
Contents of the Template
- Pre-Filled DCF Model: Trend Micro’s financial data preloaded for instant analysis.
- WACC Calculator: Comprehensive calculations for Weighted Average Cost of Capital.
- Financial Ratios: Assess Trend Micro’s profitability, leverage, and operational efficiency.
- Editable Inputs: Modify assumptions such as growth rates, profit margins, and CAPEX to suit your projections.
- Financial Statements: Annual and quarterly reports for thorough evaluation.
- Interactive Dashboard: Effortlessly visualize key valuation metrics and outcomes.
Disclaimer
All information, articles, and product details provided on this website are for general informational and educational purposes only. We do not claim any ownership over, nor do we intend to infringe upon, any trademarks, copyrights, logos, brand names, or other intellectual property mentioned or depicted on this site. Such intellectual property remains the property of its respective owners, and any references here are made solely for identification or informational purposes, without implying any affiliation, endorsement, or partnership.
We make no representations or warranties, express or implied, regarding the accuracy, completeness, or suitability of any content or products presented. Nothing on this website should be construed as legal, tax, investment, financial, medical, or other professional advice. In addition, no part of this site—including articles or product references—constitutes a solicitation, recommendation, endorsement, advertisement, or offer to buy or sell any securities, franchises, or other financial instruments, particularly in jurisdictions where such activity would be unlawful.
All content is of a general nature and may not address the specific circumstances of any individual or entity. It is not a substitute for professional advice or services. Any actions you take based on the information provided here are strictly at your own risk. You accept full responsibility for any decisions or outcomes arising from your use of this website and agree to release us from any liability in connection with your use of, or reliance upon, the content or products found herein.