
|
Oracle Corporation Japon (4716.T) Valation DCF |
Entièrement Modifiable: Adapté À Vos Besoins Dans Excel Ou Sheets
Conception Professionnelle: Modèles Fiables Et Conformes Aux Normes Du Secteur
Pré-Construits Pour Une Utilisation Rapide Et Efficace
Compatible MAC/PC, entièrement débloqué
Aucune Expertise N'Est Requise; Facile À Suivre
Oracle Corporation Japan (4716.T) Bundle
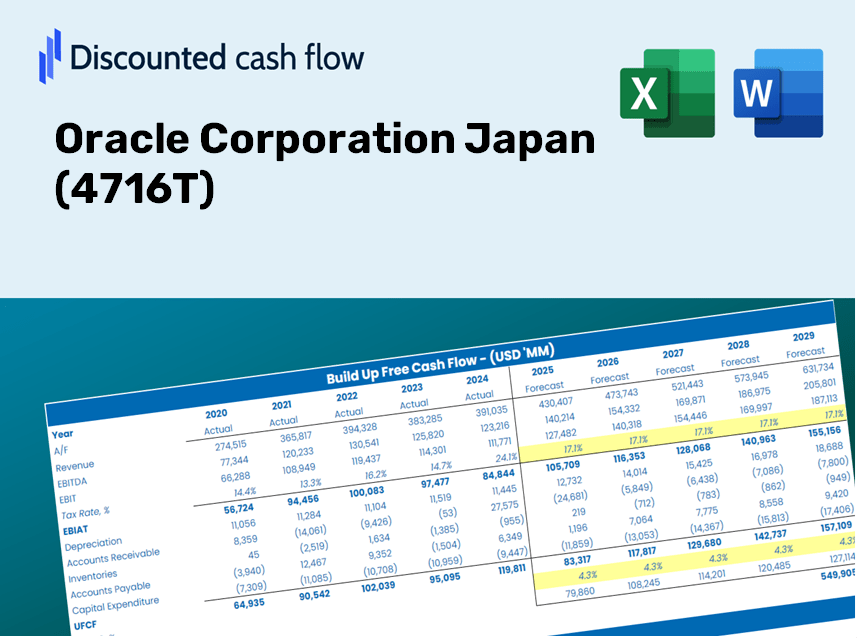
Simplifier Oracle Corporation Japan (4716T) Valation avec cette calculatrice DCF personnalisable! Doté de la vraie Corporation du Japon (4716T) et des intrants de prévision ajustés, vous pouvez tester des scénarios et découvrir Oracle Corporation Japan (4716T) la juste valeur en minutes.
Discounted Cash Flow (DCF) - (USD MM)
| Year | AY1 2021 |
AY2 2022 |
AY3 2023 |
AY4 2024 |
AY5 2025 |
FY1 2026 |
FY2 2027 |
FY3 2028 |
FY4 2029 |
FY5 2030 |
|---|---|---|---|---|---|---|---|---|---|---|
| Revenue | 208,522.0 | 214,690.0 | 226,913.0 | 244,542.0 | 263,510.0 | 279,437.1 | 296,326.9 | 314,237.6 | 333,230.8 | 353,372.0 |
| Revenue Growth, % | 0 | 2.96 | 5.69 | 7.77 | 7.76 | 6.04 | 6.04 | 6.04 | 6.04 | 6.04 |
| EBITDA | 72,954.0 | 74,868.0 | 75,722.0 | 81,132.0 | 88,096.0 | 94,918.2 | 100,655.3 | 106,739.1 | 113,190.6 | 120,032.1 |
| EBITDA, % | 34.99 | 34.87 | 33.37 | 33.18 | 33.43 | 33.97 | 33.97 | 33.97 | 33.97 | 33.97 |
| Depreciation | 2,049.0 | 1,653.0 | 1,333.0 | 1,311.0 | 1,259.0 | 1,874.4 | 1,987.7 | 2,107.9 | 2,235.3 | 2,370.4 |
| Depreciation, % | 0.98263 | 0.76995 | 0.58745 | 0.5361 | 0.47778 | 0.67078 | 0.67078 | 0.67078 | 0.67078 | 0.67078 |
| EBIT | 70,905.0 | 73,215.0 | 74,389.0 | 79,821.0 | 86,837.0 | 93,043.8 | 98,667.6 | 104,631.2 | 110,955.4 | 117,661.8 |
| EBIT, % | 34 | 34.1 | 32.78 | 32.64 | 32.95 | 33.3 | 33.3 | 33.3 | 33.3 | 33.3 |
| Total Cash | 53,964.0 | 60,142.0 | 104,531.0 | 91,904.0 | 66,616.0 | 90,996.8 | 96,496.8 | 102,329.3 | 108,514.3 | 115,073.2 |
| Total Cash, percent | .0 | .0 | .0 | .0 | .0 | .0 | .0 | .0 | .0 | .0 |
| Account Receivables | 18,779.0 | 20,764.0 | 21,330.0 | 21,182.0 | 132,573.0 | 48,649.9 | 51,590.4 | 54,708.6 | 58,015.3 | 61,521.9 |
| Account Receivables, % | 9.01 | 9.67 | 9.4 | 8.66 | 50.31 | 17.41 | 17.41 | 17.41 | 17.41 | 17.41 |
| Inventories | 3,528.0 | 190.0 | 1,598.0 | .0 | .0 | 1,388.6 | 1,472.5 | 1,561.5 | 1,655.9 | 1,756.0 |
| Inventories, % | 1.69 | 0.0884997 | 0.70423 | 0 | 0 | 0.49693 | 0.49693 | 0.49693 | 0.49693 | 0.49693 |
| Accounts Payable | 9,379.0 | 8,918.0 | 10,193.0 | 12,618.0 | 13,386.0 | 13,068.4 | 13,858.3 | 14,696.0 | 15,584.2 | 16,526.2 |
| Accounts Payable, % | 4.5 | 4.15 | 4.49 | 5.16 | 5.08 | 4.68 | 4.68 | 4.68 | 4.68 | 4.68 |
| Capital Expenditure | -98.0 | -395.0 | -765.0 | -501.0 | -1,964.0 | -848.5 | -899.8 | -954.2 | -1,011.9 | -1,073.1 |
| Capital Expenditure, % | -0.04699744 | -0.18399 | -0.33713 | -0.20487 | -0.74532 | -0.30366 | -0.30366 | -0.30366 | -0.30366 | -0.30366 |
| Tax Rate, % | 30.57 | 30.57 | 30.57 | 30.57 | 30.57 | 30.57 | 30.57 | 30.57 | 30.57 | 30.57 |
| EBITAT | 49,166.0 | 50,950.3 | 51,795.2 | 55,281.6 | 60,294.5 | 64,618.8 | 68,524.5 | 72,666.2 | 77,058.4 | 81,715.9 |
| Depreciation | ||||||||||
| Changes in Account Receivables | ||||||||||
| Changes in Inventories | ||||||||||
| Changes in Accounts Payable | ||||||||||
| Capital Expenditure | ||||||||||
| UFCF | 38,189.0 | 53,100.3 | 51,664.2 | 60,262.6 | -51,033.5 | 147,861.6 | 67,377.8 | 71,450.3 | 75,768.9 | 80,348.5 |
| WACC, % | 4.78 | 4.78 | 4.78 | 4.78 | 4.78 | 4.78 | 4.78 | 4.78 | 4.78 | 4.78 |
| PV UFCF | ||||||||||
| SUM PV UFCF | 391,090.3 | |||||||||
| Long Term Growth Rate, % | 2.00 | |||||||||
| Free cash flow (T + 1) | 81,955 | |||||||||
| Terminal Value | 2,949,475 | |||||||||
| Present Terminal Value | 2,335,505 | |||||||||
| Enterprise Value | 2,726,595 | |||||||||
| Net Debt | -66,616 | |||||||||
| Equity Value | 2,793,211 | |||||||||
| Diluted Shares Outstanding, MM | 128 | |||||||||
| Equity Value Per Share | 21,798.80 |
What You Will Receive
- Adjustable Forecast Inputs: Effortlessly modify key assumptions (growth %, margins, WACC) to generate various scenarios.
- Up-to-Date Data: Oracle Corporation Japan's financial information pre-loaded to kickstart your analysis.
- Automated DCF Outputs: The template computes Net Present Value (NPV) and intrinsic value for your convenience.
- Tailored and Professional: A refined Excel model that conforms to your valuation requirements.
- Designed for Analysts and Investors: Perfect for assessing projections, confirming strategies, and optimizing efficiency.
Key Features
- Comprehensive DCF Calculator: Offers detailed unlevered and levered DCF valuation models tailored for Oracle Corporation Japan (4716T).
- WACC Tool: Pre-designed Weighted Average Cost of Capital sheet with adjustable parameters for customized analysis.
- Customizable Forecast Inputs: Adjust growth projections, capital investments, and discount rates to fit your needs.
- Integrated Financial Ratios: Evaluate profitability, leverage, and efficiency ratios specifically for Oracle Corporation Japan (4716T).
- Visual Dashboard and Charts: Graphical representations of key valuation metrics for straightforward interpretation and analysis.
How It Works
- Step 1: Download the Excel file.
- Step 2: Review the pre-filled Oracle Corporation Japan (4716T) data, including both historical and projected figures.
- Step 3: Modify key assumptions (highlighted in yellow) based on your findings.
- Step 4: Observe the automatic recalculations for Oracle's intrinsic value.
- Step 5: Utilize the results for making investment decisions or for reporting purposes.
Why Opt for This Calculator?
- Designed for Experts: A sophisticated tool utilized by analysts, CFOs, and consultants.
- Accurate Data: Oracle's historical and anticipated financials are preloaded for precision.
- Scenario Analysis: Effortlessly test various forecasts and assumptions.
- Transparent Results: Automatically computes intrinsic value, NPV, and essential metrics.
- User-Friendly: Step-by-step guidance to help you navigate the process.
Who Can Benefit from Using Oracle Corporation Japan (4716T)?
- Finance Students: Master valuation methods and apply them using real-world data related to Oracle.
- Academics: Integrate industry-standard models into your research or teaching materials.
- Investors: Evaluate your investment strategies by analyzing the valuation metrics of Oracle Corporation Japan (4716T).
- Analysts: Enhance your efficiency with a customizable DCF model tailored for Oracle.
- Small Business Owners: Understand how major corporations like Oracle are assessed in the market.
What the Template Contains
- Historical Data: Includes Oracle Corporation Japan’s past financials and baseline forecasts.
- DCF and Levered DCF Models: Detailed templates to assess Oracle Corporation Japan’s intrinsic value.
- WACC Sheet: Pre-built calculations for Weighted Average Cost of Capital.
- Editable Inputs: Modify key drivers such as growth rates, EBITDA %, and CAPEX assumptions.
- Quarterly and Annual Statements: A complete breakdown of Oracle Corporation Japan’s financials.
- Interactive Dashboard: Visualize valuation results and projections dynamically.
Disclaimer
All information, articles, and product details provided on this website are for general informational and educational purposes only. We do not claim any ownership over, nor do we intend to infringe upon, any trademarks, copyrights, logos, brand names, or other intellectual property mentioned or depicted on this site. Such intellectual property remains the property of its respective owners, and any references here are made solely for identification or informational purposes, without implying any affiliation, endorsement, or partnership.
We make no representations or warranties, express or implied, regarding the accuracy, completeness, or suitability of any content or products presented. Nothing on this website should be construed as legal, tax, investment, financial, medical, or other professional advice. In addition, no part of this site—including articles or product references—constitutes a solicitation, recommendation, endorsement, advertisement, or offer to buy or sell any securities, franchises, or other financial instruments, particularly in jurisdictions where such activity would be unlawful.
All content is of a general nature and may not address the specific circumstances of any individual or entity. It is not a substitute for professional advice or services. Any actions you take based on the information provided here are strictly at your own risk. You accept full responsibility for any decisions or outcomes arising from your use of this website and agree to release us from any liability in connection with your use of, or reliance upon, the content or products found herein.