
|
Dexerials Corporation (4980.T) Évaluation DCF |
Entièrement Modifiable: Adapté À Vos Besoins Dans Excel Ou Sheets
Conception Professionnelle: Modèles Fiables Et Conformes Aux Normes Du Secteur
Pré-Construits Pour Une Utilisation Rapide Et Efficace
Compatible MAC/PC, entièrement débloqué
Aucune Expertise N'Est Requise; Facile À Suivre
Dexerials Corporation (4980.T) Bundle
Vous cherchez à évaluer la valeur intrinsèque de Dexerials Corporation? Notre (4980T) Calculator DCF intègre des données réelles ainsi que des fonctionnalités de personnalisation approfondies, vous permettant d'affiner vos prévisions et d'améliorer vos stratégies d'investissement.
Benefits of Choosing Dexerials Corporation (4980T)
- Flexible Forecast Settings: Adjust key assumptions (growth %, margins, WACC) to explore various scenarios easily.
- Comprehensive Financial Data: Dexerials’ financial information is pre-loaded to facilitate your analysis.
- Instant DCF Calculations: The template automatically computes Net Present Value (NPV) and intrinsic value for your convenience.
- Professional and Adaptable: A refined Excel model that easily aligns with your valuation objectives.
- Designed for Analysts and Investors: Perfect for validating projections, refining strategies, and enhancing efficiency.
Key Features
- Advanced DCF Calculator: Offers comprehensive unlevered and levered DCF valuation models tailored for Dexerials Corporation (4980T).
- WACC Calculator: Features a pre-configured Weighted Average Cost of Capital sheet with adjustable inputs for personalized calculations.
- Editable Forecast Assumptions: Easily alter growth rates, capital expenditures, and discount rates to fit your analysis needs.
- Built-In Financial Ratios: Examine profitability, leverage, and efficiency ratios specifically for Dexerials Corporation (4980T).
- Dashboard and Charts: Visual representations present key valuation metrics for straightforward assessment.
How It Operates
- Download the Template: Gain immediate access to the Excel-based DCF Calculator for Dexerials Corporation (4980T).
- Input Your Assumptions: Modify the yellow-highlighted cells to set your growth rates, WACC, margins, and other variables.
- Instant Calculations: The model automatically recalculates Dexerials Corporation's intrinsic value.
- Test Scenarios: Experiment with various assumptions to assess potential changes in valuation.
- Analyze and Decide: Utilize the findings to inform your investment decisions or financial analysis.
Why Opt for This Calculator?
- All-in-One Solution: Combines DCF, WACC, and financial ratio analyses seamlessly.
- Flexible Inputs: Modify the highlighted cells to explore different scenarios.
- In-Depth Analysis: Automatically computes Dexerials Corporation’s intrinsic value and Net Present Value.
- Preloaded Information: Historical and projected data provide reliable starting figures.
- High-Quality Standards: Perfect for financial analysts, investors, and business consultants.
Who Can Benefit from Dexerials Corporation (4980T)?
- Investors: Empower your investment choices with a robust valuation tool designed for precision.
- Financial Analysts: Streamline your workflow with an easily customizable, pre-built DCF model.
- Consultants: Effortlessly modify the template for impactful client presentations and reports.
- Finance Enthusiasts: Enhance your grasp of valuation methods through real-life case studies.
- Educators and Students: Utilize it as a hands-on resource for finance-related coursework.
Contents of the Template
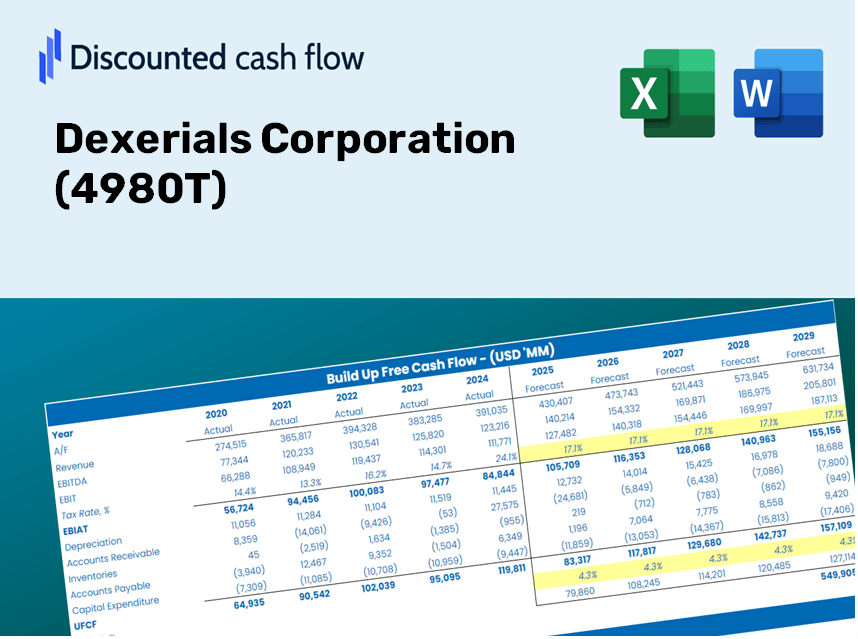
- Historical Data: Contains Dexerials Corporation's past financial performance and baseline projections.
- DCF and Levered DCF Models: Comprehensive templates for assessing the intrinsic value of Dexerials Corporation (4980T).
- WACC Sheet: Pre-configured calculations for the Weighted Average Cost of Capital.
- Editable Inputs: Adjust essential parameters such as growth rates, EBITDA %, and CAPEX predictions.
- Quarterly and Annual Statements: A detailed overview of Dexerials Corporation's financials.
- Interactive Dashboard: Engage with dynamic visuals to explore valuation outcomes and future forecasts.
Disclaimer
All information, articles, and product details provided on this website are for general informational and educational purposes only. We do not claim any ownership over, nor do we intend to infringe upon, any trademarks, copyrights, logos, brand names, or other intellectual property mentioned or depicted on this site. Such intellectual property remains the property of its respective owners, and any references here are made solely for identification or informational purposes, without implying any affiliation, endorsement, or partnership.
We make no representations or warranties, express or implied, regarding the accuracy, completeness, or suitability of any content or products presented. Nothing on this website should be construed as legal, tax, investment, financial, medical, or other professional advice. In addition, no part of this site—including articles or product references—constitutes a solicitation, recommendation, endorsement, advertisement, or offer to buy or sell any securities, franchises, or other financial instruments, particularly in jurisdictions where such activity would be unlawful.
All content is of a general nature and may not address the specific circumstances of any individual or entity. It is not a substitute for professional advice or services. Any actions you take based on the information provided here are strictly at your own risk. You accept full responsibility for any decisions or outcomes arising from your use of this website and agree to release us from any liability in connection with your use of, or reliance upon, the content or products found herein.