
|
Nichias Corporation (5393.T) Évaluation DCF |
Entièrement Modifiable: Adapté À Vos Besoins Dans Excel Ou Sheets
Conception Professionnelle: Modèles Fiables Et Conformes Aux Normes Du Secteur
Pré-Construits Pour Une Utilisation Rapide Et Efficace
Compatible MAC/PC, entièrement débloqué
Aucune Expertise N'Est Requise; Facile À Suivre
Nichias Corporation (5393.T) Bundle
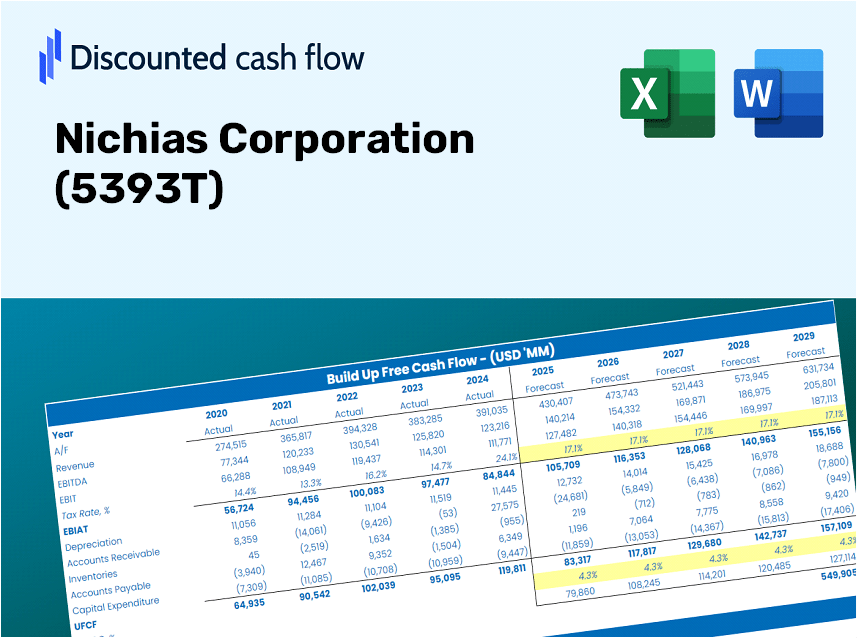
Gardez un aperçu de l'analyse de l'évaluation de votre Nichias Corporation (5393T) avec notre calculatrice DCF de pointe! Équipé de données en temps réel pour (5393T), ce modèle Excel vous permet d'ajuster les prévisions et les hypothèses, permettant des calculs précis de la valeur intrinsèque de Nichias Corporation.
Discounted Cash Flow (DCF) - (USD MM)
| Year | AY1 2021 |
AY2 2022 |
AY3 2023 |
AY4 2024 |
AY5 2025 |
FY1 2026 |
FY2 2027 |
FY3 2028 |
FY4 2029 |
FY5 2030 |
|---|---|---|---|---|---|---|---|---|---|---|
| Revenue | 196,371.0 | 216,236.0 | 238,116.0 | 249,391.0 | 256,512.0 | 274,355.7 | 293,440.6 | 313,853.1 | 335,685.6 | 359,036.7 |
| Revenue Growth, % | 0 | 10.12 | 10.12 | 4.74 | 2.86 | 6.96 | 6.96 | 6.96 | 6.96 | 6.96 |
| EBITDA | 24,239.0 | 37,444.0 | 38,440.0 | 46,107.0 | 53,217.0 | 46,661.0 | 49,906.8 | 53,378.5 | 57,091.6 | 61,063.1 |
| EBITDA, % | 12.34 | 17.32 | 16.14 | 18.49 | 20.75 | 17.01 | 17.01 | 17.01 | 17.01 | 17.01 |
| Depreciation | 6,536.0 | 6,616.0 | 7,454.0 | 7,593.0 | 7,626.0 | 8,524.8 | 9,117.8 | 9,752.0 | 10,430.4 | 11,156.0 |
| Depreciation, % | 3.33 | 3.06 | 3.13 | 3.04 | 2.97 | 3.11 | 3.11 | 3.11 | 3.11 | 3.11 |
| EBIT | 17,703.0 | 30,828.0 | 30,986.0 | 38,514.0 | 45,591.0 | 38,136.2 | 40,789.0 | 43,626.4 | 46,661.2 | 49,907.1 |
| EBIT, % | 9.02 | 14.26 | 13.01 | 15.44 | 17.77 | 13.9 | 13.9 | 13.9 | 13.9 | 13.9 |
| Total Cash | 39,799.0 | 54,597.0 | 59,433.0 | 56,376.0 | 59,678.0 | 63,840.6 | 68,281.5 | 73,031.3 | 78,111.6 | 83,545.3 |
| Total Cash, percent | .0 | .0 | .0 | .0 | .0 | .0 | .0 | .0 | .0 | .0 |
| Account Receivables | 58,948.0 | 64,360.0 | 69,367.0 | 75,447.0 | 72,010.0 | 80,791.9 | 86,412.0 | 92,423.0 | 98,852.2 | 105,728.7 |
| Account Receivables, % | 30.02 | 29.76 | 29.13 | 30.25 | 28.07 | 29.45 | 29.45 | 29.45 | 29.45 | 29.45 |
| Inventories | 33,666.0 | 36,719.0 | 43,591.0 | 49,907.0 | 54,694.0 | 51,450.2 | 55,029.2 | 58,857.1 | 62,951.4 | 67,330.5 |
| Inventories, % | 17.14 | 16.98 | 18.31 | 20.01 | 21.32 | 18.75 | 18.75 | 18.75 | 18.75 | 18.75 |
| Accounts Payable | 24,071.0 | 28,589.0 | 29,854.0 | 23,401.0 | 26,826.0 | 31,747.3 | 33,955.7 | 36,317.8 | 38,844.2 | 41,546.3 |
| Accounts Payable, % | 12.26 | 13.22 | 12.54 | 9.38 | 10.46 | 11.57 | 11.57 | 11.57 | 11.57 | 11.57 |
| Capital Expenditure | -8,298.0 | -9,601.0 | -8,629.0 | -12,840.0 | -6,764.0 | -11,015.4 | -11,781.7 | -12,601.2 | -13,477.8 | -14,415.4 |
| Capital Expenditure, % | -4.23 | -4.44 | -3.62 | -5.15 | -2.64 | -4.02 | -4.02 | -4.02 | -4.02 | -4.02 |
| Tax Rate, % | 29.29 | 29.29 | 29.29 | 29.29 | 29.29 | 29.29 | 29.29 | 29.29 | 29.29 | 29.29 |
| EBITAT | 10,819.5 | 22,141.0 | 21,511.9 | 27,074.9 | 32,237.8 | 26,189.8 | 28,011.6 | 29,960.2 | 32,044.3 | 34,273.4 |
| Depreciation | ||||||||||
| Changes in Account Receivables | ||||||||||
| Changes in Inventories | ||||||||||
| Changes in Accounts Payable | ||||||||||
| Capital Expenditure | ||||||||||
| UFCF | -59,485.5 | 15,209.0 | 9,722.9 | 2,978.9 | 35,174.8 | 23,082.4 | 18,357.1 | 19,634.0 | 20,999.8 | 22,460.6 |
| WACC, % | 6.44 | 6.45 | 6.45 | 6.45 | 6.45 | 6.45 | 6.45 | 6.45 | 6.45 | 6.45 |
| PV UFCF | ||||||||||
| SUM PV UFCF | 86,949.1 | |||||||||
| Long Term Growth Rate, % | 0.50 | |||||||||
| Free cash flow (T + 1) | 22,573 | |||||||||
| Terminal Value | 379,431 | |||||||||
| Present Terminal Value | 277,602 | |||||||||
| Enterprise Value | 364,551 | |||||||||
| Net Debt | -48,637 | |||||||||
| Equity Value | 413,188 | |||||||||
| Diluted Shares Outstanding, MM | 65 | |||||||||
| Equity Value Per Share | 6,329.95 |
What You Will Receive
- Ready-to-Use Financial Model: Leverage Nichias Corporation's actual data for accurate DCF valuation.
- Comprehensive Forecast Control: Modify revenue growth, profit margins, WACC, and other critical variables.
- Real-Time Calculations: Automatic updates provide immediate insights as you adjust parameters.
- Professional-Grade Template: A polished Excel file specifically crafted for high-quality valuation.
- Flexible and Reusable: Designed for adaptability, allowing for repeated use in detailed forecasting.
Key Features
- 🔍 Real-Life NICH Financials: Pre-filled historical and projected data for Nichias Corporation (5393T).
- ✏️ Fully Customizable Inputs: Modify all essential parameters (yellow cells) such as WACC, growth %, and tax rates.
- 📊 Professional DCF Valuation: Integrated formulas that compute Nichias’ intrinsic value utilizing the Discounted Cash Flow method.
- ⚡ Instant Results: Visualize Nichias’ valuation immediately after adjustments.
- Scenario Analysis: Evaluate and contrast outcomes for different financial assumptions side-by-side.
How It Functions
- Step 1: Download the Excel file.
- Step 2: Examine the pre-filled Nichias Corporation (5393T) data (both historical and projected).
- Step 3: Modify the key assumptions (highlighted in yellow) according to your insights.
- Step 4: Observe the automatic updates for Nichias Corporation's (5393T) intrinsic value.
- Step 5: Utilize the results for your investment strategies or reporting needs.
Why Choose the Nichias Corporation (5393T) Calculator?
- Precision: Utilizes genuine Nichias financial data to ensure accuracy.
- Customizability: Built for users to easily test and adjust inputs as needed.
- Efficiency: Eliminate the complexities of creating a DCF model from scratch.
- Expert-Level: Crafted with the precision and usability expected by CFOs.
- Intuitive: Simple and accessible, even for those new to financial modeling.
Who Can Benefit from This Product?
- Institutional Investors: Develop comprehensive and accurate valuation models for portfolio assessment related to Nichias Corporation (5393T).
- Corporate Finance Departments: Evaluate valuation scenarios to shape strategic decisions within the organization.
- Consultants and Financial Advisors: Deliver precise valuation insights for clients interested in Nichias Corporation (5393T).
- Students and Educators: Utilize real-market data to enhance learning and practice in financial modeling.
- Industry Enthusiasts: Gain insights into how companies like Nichias Corporation (5393T) are valued in the marketplace.
Contents of the Template
- Historical Data: Contains Nichias Corporation’s past financials and baseline forecasts.
- DCF and Levered DCF Models: Comprehensive templates for estimating the intrinsic value of Nichias Corporation (5393T).
- WACC Sheet: Pre-calculated metrics for the Weighted Average Cost of Capital.
- Editable Inputs: Customize key drivers such as growth rates, EBITDA percentages, and CAPEX estimates.
- Quarterly and Annual Statements: An in-depth analysis of Nichias Corporation's financials.
- Interactive Dashboard: Dynamically visualize valuation outcomes and forecasts.
Disclaimer
All information, articles, and product details provided on this website are for general informational and educational purposes only. We do not claim any ownership over, nor do we intend to infringe upon, any trademarks, copyrights, logos, brand names, or other intellectual property mentioned or depicted on this site. Such intellectual property remains the property of its respective owners, and any references here are made solely for identification or informational purposes, without implying any affiliation, endorsement, or partnership.
We make no representations or warranties, express or implied, regarding the accuracy, completeness, or suitability of any content or products presented. Nothing on this website should be construed as legal, tax, investment, financial, medical, or other professional advice. In addition, no part of this site—including articles or product references—constitutes a solicitation, recommendation, endorsement, advertisement, or offer to buy or sell any securities, franchises, or other financial instruments, particularly in jurisdictions where such activity would be unlawful.
All content is of a general nature and may not address the specific circumstances of any individual or entity. It is not a substitute for professional advice or services. Any actions you take based on the information provided here are strictly at your own risk. You accept full responsibility for any decisions or outcomes arising from your use of this website and agree to release us from any liability in connection with your use of, or reliance upon, the content or products found herein.