
|
Nippon Steel Corporation (5401.T) Évaluation DCF |
Entièrement Modifiable: Adapté À Vos Besoins Dans Excel Ou Sheets
Conception Professionnelle: Modèles Fiables Et Conformes Aux Normes Du Secteur
Pré-Construits Pour Une Utilisation Rapide Et Efficace
Compatible MAC/PC, entièrement débloqué
Aucune Expertise N'Est Requise; Facile À Suivre
Nippon Steel Corporation (5401.T) Bundle
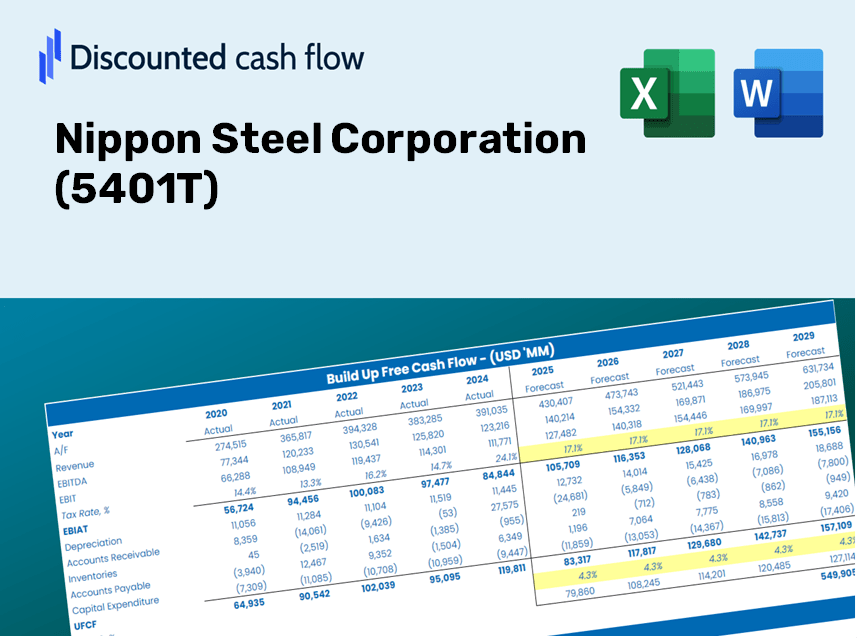
Évaluez les perspectives financières de Nippon Steel Corporation comme un expert! Ce (5401T) Calculator DCF vous fournit des données financières pré-remplies et vous permet de modifier facilement la croissance des revenus, le WACC, les marges et d'autres hypothèses essentielles pour vous aligner sur vos projections.
Discounted Cash Flow (DCF) - (USD MM)
| Year | AY1 2021 |
AY2 2022 |
AY3 2023 |
AY4 2024 |
AY5 2025 |
FY1 2026 |
FY2 2027 |
FY3 2028 |
FY4 2029 |
FY5 2030 |
|---|---|---|---|---|---|---|---|---|---|---|
| Revenue | 4,829,272.0 | 6,808,890.0 | 7,975,586.0 | 8,868,097.0 | 8,695,526.0 | 10,160,102.9 | 11,871,356.7 | 13,870,834.8 | 16,207,082.7 | 18,936,821.9 |
| Revenue Growth, % | 0 | 40.99 | 17.13 | 11.19 | -1.95 | 16.84 | 16.84 | 16.84 | 16.84 | 16.84 |
| EBITDA | 307,611.0 | 958,958.0 | 1,231,908.0 | 1,018,878.0 | 827,144.0 | 1,156,243.3 | 1,350,988.0 | 1,578,533.2 | 1,844,403.7 | 2,155,054.3 |
| EBITDA, % | 6.37 | 14.08 | 15.45 | 11.49 | 9.51 | 11.38 | 11.38 | 11.38 | 11.38 | 11.38 |
| Depreciation | 290,863.0 | 330,611.0 | 340,171.0 | 363,002.0 | 385,243.0 | 480,925.5 | 561,927.2 | 656,571.9 | 767,157.5 | 896,368.9 |
| Depreciation, % | 6.02 | 4.86 | 4.27 | 4.09 | 4.43 | 4.73 | 4.73 | 4.73 | 4.73 | 4.73 |
| EBIT | 16,748.0 | 628,347.0 | 891,737.0 | 655,876.0 | 441,901.0 | 675,317.8 | 789,060.8 | 921,961.3 | 1,077,246.1 | 1,258,685.4 |
| EBIT, % | 0.3468 | 9.23 | 11.18 | 7.4 | 5.08 | 6.65 | 6.65 | 6.65 | 6.65 | 6.65 |
| Total Cash | 359,465.0 | 572,380.0 | 687,957.0 | 464,914.0 | 696,311.0 | 766,597.0 | 895,714.0 | 1,046,578.0 | 1,222,851.9 | 1,428,815.4 |
| Total Cash, percent | .0 | .0 | .0 | .0 | .0 | .0 | .0 | .0 | .0 | .0 |
| Account Receivables | 805,306.0 | 939,406.0 | 1,062,384.0 | 1,587,979.0 | 1,430,435.0 | 1,588,016.2 | 1,855,483.9 | 2,168,000.8 | 2,533,154.5 | 2,959,810.6 |
| Account Receivables, % | 16.68 | 13.8 | 13.32 | 17.91 | 16.45 | 15.63 | 15.63 | 15.63 | 15.63 | 15.63 |
| Inventories | 1,349,355.0 | 1,756,589.0 | 2,085,971.0 | 2,276,665.0 | 2,199,096.0 | 2,659,032.8 | 3,106,890.5 | 3,630,180.2 | 4,241,607.1 | 4,956,015.8 |
| Inventories, % | 27.94 | 25.8 | 26.15 | 25.67 | 25.29 | 26.17 | 26.17 | 26.17 | 26.17 | 26.17 |
| Accounts Payable | 609,144.0 | 748,482.0 | 758,422.0 | 869,757.0 | 774,020.0 | 1,053,087.7 | 1,230,458.0 | 1,437,702.5 | 1,679,853.0 | 1,962,788.6 |
| Accounts Payable, % | 12.61 | 10.99 | 9.51 | 9.81 | 8.9 | 10.36 | 10.36 | 10.36 | 10.36 | 10.36 |
| Capital Expenditure | -459,811.0 | -466,902.0 | -470,018.0 | -466,345.0 | -618,194.0 | -703,887.8 | -822,442.8 | -960,965.8 | -1,122,820.1 | -1,311,935.4 |
| Capital Expenditure, % | -9.52 | -6.86 | -5.89 | -5.26 | -7.11 | -6.93 | -6.93 | -6.93 | -6.93 | -6.93 |
| Tax Rate, % | 11.89 | 11.89 | 11.89 | 11.89 | 11.89 | 11.89 | 11.89 | 11.89 | 11.89 | 11.89 |
| EBITAT | 62,750.8 | 490,407.9 | 713,941.8 | 471,640.2 | 389,371.2 | 564,743.9 | 659,863.1 | 771,003.0 | 900,862.1 | 1,052,593.2 |
| Depreciation | ||||||||||
| Changes in Account Receivables | ||||||||||
| Changes in Inventories | ||||||||||
| Changes in Accounts Payable | ||||||||||
| Capital Expenditure | ||||||||||
| UFCF | -1,651,714.2 | -47,879.1 | 141,674.8 | -236,656.8 | 295,796.2 | 3,331.3 | -138,607.6 | -161,953.1 | -189,230.6 | -221,102.5 |
| WACC, % | 6.18 | 5.82 | 5.85 | 5.72 | 5.98 | 5.91 | 5.91 | 5.91 | 5.91 | 5.91 |
| PV UFCF | ||||||||||
| SUM PV UFCF | -573,089.4 | |||||||||
| Long Term Growth Rate, % | 0.50 | |||||||||
| Free cash flow (T + 1) | -222,208 | |||||||||
| Terminal Value | -4,107,996 | |||||||||
| Present Terminal Value | -3,082,921 | |||||||||
| Enterprise Value | -3,656,011 | |||||||||
| Net Debt | 1,834,966 | |||||||||
| Equity Value | -5,490,977 | |||||||||
| Diluted Shares Outstanding, MM | 5,225 | |||||||||
| Equity Value Per Share | -1,050.95 |
What You Will Receive
- Authentic Nippon Steel Data: Preloaded financial metrics – including revenue and EBIT – derived from actual and projected figures.
- Complete Customization: Modify all essential parameters (highlighted cells) such as WACC, growth %, and tax rates.
- Instant Valuation Updates: Automatic recalculations to evaluate the effects of changes on Nippon Steel's fair value.
- Flexible Excel Template: Designed for quick modifications, scenario analysis, and comprehensive projections.
- Efficient and Accurate: Avoid the hassle of building models from the ground up while ensuring precision and adaptability.
Key Features
- Customizable Forecast Inputs: Adjust essential parameters such as revenue growth, EBITDA %, and capital investments.
- Instant DCF Valuation: Quickly derives intrinsic value, NPV, and other financial metrics.
- High-Precision Accuracy: Leverages Nippon Steel’s actual financial data for credible valuation results.
- Simplified Scenario Analysis: Easily explore various assumptions and evaluate different outcomes.
- Efficiency Booster: Streamline your process without the hassle of creating intricate valuation models from the ground up.
How It Works
- 1. Access the Template: Download and open the Excel file featuring Nippon Steel Corporation’s preloaded data.
- 2. Modify Assumptions: Adjust key variables such as growth rates, WACC, and capital expenditures.
- 3. Instant Results: The DCF model automatically calculates intrinsic value and NPV in real-time.
- 4. Explore Scenarios: Analyze various forecasts to evaluate different valuation outcomes.
- 5. Present with Confidence: Share professional valuation insights to back your investment decisions.
Why Opt for This Calculator?
- All-in-One Solution: Combines DCF, WACC, and financial ratio evaluations in a single tool.
- Flexible Configurations: Modify the yellow-highlighted fields to explore different scenarios.
- In-Depth Analysis: Automatically computes Nippon Steel Corporation’s intrinsic value and Net Present Value.
- Pre-Loaded Information: Historical and projected data provide a solid foundation for analysis.
- High-Quality Insights: Perfect for financial analysts, investors, and business consultants.
Who Can Benefit from This Product?
- Individual Investors: Gain insights to make informed decisions regarding the purchase or sale of Nippon Steel Corporation (5401T) shares.
- Financial Analysts: Enhance your valuation processes with easily accessible financial models tailored for Nippon Steel Corporation (5401T).
- Consultants: Provide your clients with accurate and timely valuation insights related to Nippon Steel Corporation (5401T).
- Business Owners: Learn how major players like Nippon Steel Corporation (5401T) are valued to shape your own business strategies.
- Finance Students: Acquire practical valuation skills using real data and case studies from Nippon Steel Corporation (5401T).
What the Template Includes
- Pre-Filled Data: Contains Nippon Steel Corporation’s historical financials and projections.
- Discounted Cash Flow Model: An editable DCF valuation model with automated calculations.
- Weighted Average Cost of Capital (WACC): A specific sheet designed for WACC calculations using tailored inputs.
- Key Financial Ratios: Evaluate Nippon Steel’s profitability, operational efficiency, and financial leverage.
- Customizable Inputs: Easily modify revenue growth rates, profit margins, and tax assumptions.
- Clear Dashboard: Visual representations and tables summarizing essential valuation outcomes.
Disclaimer
All information, articles, and product details provided on this website are for general informational and educational purposes only. We do not claim any ownership over, nor do we intend to infringe upon, any trademarks, copyrights, logos, brand names, or other intellectual property mentioned or depicted on this site. Such intellectual property remains the property of its respective owners, and any references here are made solely for identification or informational purposes, without implying any affiliation, endorsement, or partnership.
We make no representations or warranties, express or implied, regarding the accuracy, completeness, or suitability of any content or products presented. Nothing on this website should be construed as legal, tax, investment, financial, medical, or other professional advice. In addition, no part of this site—including articles or product references—constitutes a solicitation, recommendation, endorsement, advertisement, or offer to buy or sell any securities, franchises, or other financial instruments, particularly in jurisdictions where such activity would be unlawful.
All content is of a general nature and may not address the specific circumstances of any individual or entity. It is not a substitute for professional advice or services. Any actions you take based on the information provided here are strictly at your own risk. You accept full responsibility for any decisions or outcomes arising from your use of this website and agree to release us from any liability in connection with your use of, or reliance upon, the content or products found herein.