
|
Tokyo Steel Manufacturing Co., Ltd. (5423.T) Évaluation DCF |
Entièrement Modifiable: Adapté À Vos Besoins Dans Excel Ou Sheets
Conception Professionnelle: Modèles Fiables Et Conformes Aux Normes Du Secteur
Pré-Construits Pour Une Utilisation Rapide Et Efficace
Compatible MAC/PC, entièrement débloqué
Aucune Expertise N'Est Requise; Facile À Suivre
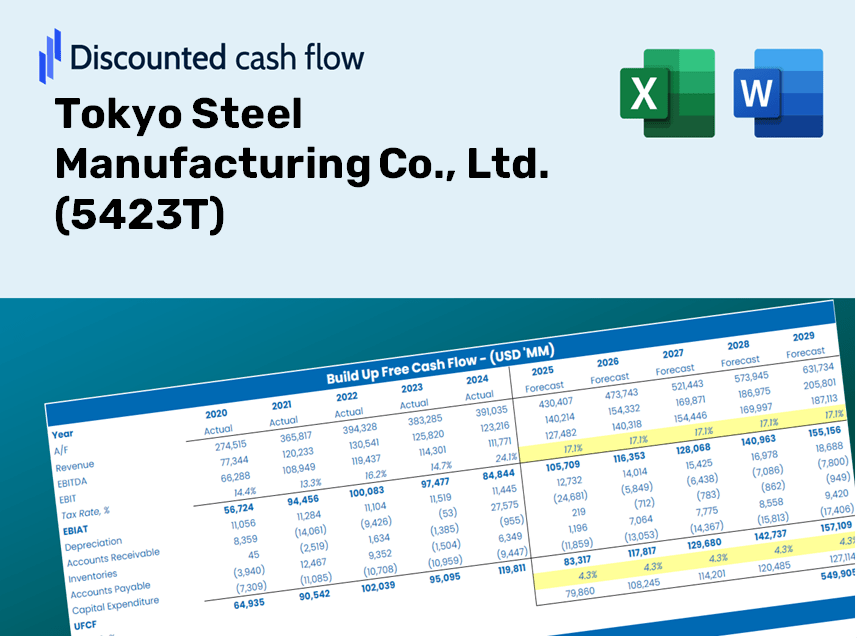
Tokyo Steel Manufacturing Co., Ltd. (5423.T) Bundle
Simplifiez Tokyo Steel Manufacturing Co., Ltd. (5423T) Valation avec cette calculatrice DCF personnalisable! Doté de Real Tokyo Steel Manufacturing Co., Ltd. (5423T) Financials and Rajustement des entrées de prévision, vous pouvez tester des scénarios et découvrir Tokyo Steel Manufacturing Co., Ltd. (5423T) FAIT VALEUR en minutes.
Discounted Cash Flow (DCF) - (USD MM)
| Year | AY1 2020 |
AY2 2021 |
AY3 2022 |
AY4 2023 |
AY5 2024 |
FY1 2025 |
FY2 2026 |
FY3 2027 |
FY4 2028 |
FY5 2029 |
|---|---|---|---|---|---|---|---|---|---|---|
| Revenue | 141,448.0 | 270,883.0 | 361,245.0 | 367,242.0 | 326,775.0 | 322,471.4 | 318,224.5 | 314,033.6 | 309,897.8 | 305,816.5 |
| Revenue Growth, % | 0 | 91.51 | 33.36 | 1.66 | -11.02 | -1.32 | -1.32 | -1.32 | -1.32 | -1.32 |
| EBITDA | 9,880.0 | 36,332.0 | 43,702.0 | 45,714.0 | 36,545.0 | 36,198.3 | 35,721.6 | 35,251.1 | 34,786.9 | 34,328.8 |
| EBITDA, % | 6.98 | 13.41 | 12.1 | 12.45 | 11.18 | 11.23 | 11.23 | 11.23 | 11.23 | 11.23 |
| Depreciation | 5,562.0 | 4,558.0 | 5,031.0 | 5,934.0 | 6,809.0 | 6,905.4 | 6,814.5 | 6,724.7 | 6,636.2 | 6,548.8 |
| Depreciation, % | 3.93 | 1.68 | 1.39 | 1.62 | 2.08 | 2.14 | 2.14 | 2.14 | 2.14 | 2.14 |
| EBIT | 4,318.0 | 31,774.0 | 38,671.0 | 39,780.0 | 29,736.0 | 29,292.9 | 28,907.1 | 28,526.4 | 28,150.7 | 27,780.0 |
| EBIT, % | 3.05 | 11.73 | 10.7 | 10.83 | 9.1 | 9.08 | 9.08 | 9.08 | 9.08 | 9.08 |
| Total Cash | 58,332.0 | 68,644.0 | 85,074.0 | 112,219.0 | 96,111.0 | 96,805.6 | 95,530.7 | 94,272.5 | 93,031.0 | 91,805.8 |
| Total Cash, percent | .0 | .0 | .0 | .0 | .0 | .0 | .0 | .0 | .0 | .0 |
| Account Receivables | 18,237.0 | 30,867.0 | 36,617.0 | 36,808.0 | 29,188.0 | 34,426.6 | 33,973.2 | 33,525.8 | 33,084.3 | 32,648.6 |
| Account Receivables, % | 12.89 | 11.39 | 10.14 | 10.02 | 8.93 | 10.68 | 10.68 | 10.68 | 10.68 | 10.68 |
| Inventories | 27,704.0 | 46,974.0 | 47,773.0 | 44,254.0 | 36,899.0 | 47,399.3 | 46,775.1 | 46,159.1 | 45,551.2 | 44,951.3 |
| Inventories, % | 19.59 | 17.34 | 13.22 | 12.05 | 11.29 | 14.7 | 14.7 | 14.7 | 14.7 | 14.7 |
| Accounts Payable | 27,456.0 | 45,265.0 | 49,779.0 | 52,253.0 | 37,127.0 | 48,687.3 | 48,046.1 | 47,413.3 | 46,788.9 | 46,172.7 |
| Accounts Payable, % | 19.41 | 16.71 | 13.78 | 14.23 | 11.36 | 15.1 | 15.1 | 15.1 | 15.1 | 15.1 |
| Capital Expenditure | -7,418.0 | -9,790.0 | -9,177.0 | -16,719.0 | -22,362.0 | -14,701.2 | -14,507.6 | -14,316.6 | -14,128.0 | -13,942.0 |
| Capital Expenditure, % | -5.24 | -3.61 | -2.54 | -4.55 | -6.84 | -4.56 | -4.56 | -4.56 | -4.56 | -4.56 |
| Tax Rate, % | 28.63 | 28.63 | 28.63 | 28.63 | 28.63 | 28.63 | 28.63 | 28.63 | 28.63 | 28.63 |
| EBITAT | 5,923.3 | 30,861.8 | 30,860.0 | 27,966.4 | 21,223.0 | 24,524.3 | 24,201.3 | 23,882.6 | 23,568.0 | 23,257.6 |
| Depreciation | ||||||||||
| Changes in Account Receivables | ||||||||||
| Changes in Inventories | ||||||||||
| Changes in Accounts Payable | ||||||||||
| Capital Expenditure | ||||||||||
| UFCF | -14,417.7 | 11,538.8 | 24,679.0 | 22,983.4 | 5,519.0 | 12,549.8 | 16,944.6 | 16,721.4 | 16,501.2 | 16,283.9 |
| WACC, % | 6.34 | 6.34 | 6.33 | 6.33 | 6.33 | 6.33 | 6.33 | 6.33 | 6.33 | 6.33 |
| PV UFCF | ||||||||||
| SUM PV UFCF | 65,584.0 | |||||||||
| Long Term Growth Rate, % | 0.50 | |||||||||
| Free cash flow (T + 1) | 16,365 | |||||||||
| Terminal Value | 280,585 | |||||||||
| Present Terminal Value | 206,411 | |||||||||
| Enterprise Value | 271,995 | |||||||||
| Net Debt | -21,072 | |||||||||
| Equity Value | 293,067 | |||||||||
| Diluted Shares Outstanding, MM | 107 | |||||||||
| Equity Value Per Share | 2,736.17 |
Benefits You Will Receive
- Pre-Loaded Financial Model: Tokyo Steel’s actual performance data facilitates accurate DCF valuation.
- Comprehensive Forecast Adjustments: Modify revenue growth, profit margins, WACC, and other essential variables.
- Real-Time Calculations: Automatic updates provide immediate results as you make edits.
- Professional-Grade Template: A polished Excel file tailored for top-tier valuation.
- Flexible and Reusable: Designed for versatility, allowing repeated application for in-depth forecasts.
Key Features
- Pre-Loaded Data: Tokyo Steel Manufacturing’s historical financial statements and pre-filled forecasts.
- Fully Adjustable Inputs: Customize WACC, tax rates, revenue growth, and EBITDA margins.
- Instant Results: Observe Tokyo Steel’s intrinsic value recalculating in real-time.
- Clear Visual Outputs: Dashboard charts present valuation results and key metrics.
- Built for Accuracy: A professional tool designed for analysts, investors, and finance professionals.
How It Works
- Step 1: Download the prebuilt Excel template featuring Tokyo Steel Manufacturing Co., Ltd.'s data.
- Step 2: Review the pre-filled sheets to gain insights into the key metrics.
- Step 3: Modify forecasts and assumptions in the editable yellow cells (WACC, growth, margins).
- Step 4: Instantly see recalculated results, including Tokyo Steel Manufacturing Co., Ltd.'s intrinsic value.
- Step 5: Utilize the outputs to make informed investment decisions or create comprehensive reports.
Why Opt for This Calculator?
- Designed for Industry Experts: A sophisticated tool utilized by analysts, CFOs, and industry consultants.
- Accurate Data Sets: Tokyo Steel Manufacturing’s historical and projected financials are preloaded for precision.
- Flexible Scenario Analysis: Easily simulate various forecasts and assumptions for better decision-making.
- Intuitive Outputs: Automatically computes intrinsic value, NPV, and essential financial metrics.
- User-Friendly: Comprehensive step-by-step guidance makes the process straightforward.
Who Should Utilize This Product?
- Investors: Accurately assess the fair value of Tokyo Steel Manufacturing Co., Ltd. (5423T) before making investment decisions.
- CFOs: Utilize a professional-grade DCF model for comprehensive financial reporting and analysis.
- Consultants: Easily customize the template for client valuation reports.
- Entrepreneurs: Acquire insights into the financial modeling practices of leading manufacturing firms.
- Educators: Employ this resource as a teaching aid to illustrate valuation techniques.
Contents of the Template
- Preloaded TSMC Data: Historical and forecasted financial information, including revenue, EBIT, and capital expenditures.
- DCF and WACC Models: Advanced sheets designed for calculating intrinsic value and Weighted Average Cost of Capital.
- Editable Inputs: Yellow-highlighted cells available for customizing revenue growth, tax rates, and discount rates.
- Financial Statements: Detailed annual and quarterly financial reports for in-depth analysis.
- Key Ratios: Performance metrics on profitability, leverage, and efficiency.
- Dashboard and Charts: Visual representation of valuation results and underlying assumptions.
Disclaimer
All information, articles, and product details provided on this website are for general informational and educational purposes only. We do not claim any ownership over, nor do we intend to infringe upon, any trademarks, copyrights, logos, brand names, or other intellectual property mentioned or depicted on this site. Such intellectual property remains the property of its respective owners, and any references here are made solely for identification or informational purposes, without implying any affiliation, endorsement, or partnership.
We make no representations or warranties, express or implied, regarding the accuracy, completeness, or suitability of any content or products presented. Nothing on this website should be construed as legal, tax, investment, financial, medical, or other professional advice. In addition, no part of this site—including articles or product references—constitutes a solicitation, recommendation, endorsement, advertisement, or offer to buy or sell any securities, franchises, or other financial instruments, particularly in jurisdictions where such activity would be unlawful.
All content is of a general nature and may not address the specific circumstances of any individual or entity. It is not a substitute for professional advice or services. Any actions you take based on the information provided here are strictly at your own risk. You accept full responsibility for any decisions or outcomes arising from your use of this website and agree to release us from any liability in connection with your use of, or reliance upon, the content or products found herein.