
|
Yamato Kogyo Co., Ltd. (5444.T) Évaluation DCF |
Entièrement Modifiable: Adapté À Vos Besoins Dans Excel Ou Sheets
Conception Professionnelle: Modèles Fiables Et Conformes Aux Normes Du Secteur
Pré-Construits Pour Une Utilisation Rapide Et Efficace
Compatible MAC/PC, entièrement débloqué
Aucune Expertise N'Est Requise; Facile À Suivre
Yamato Kogyo Co., Ltd. (5444.T) Bundle
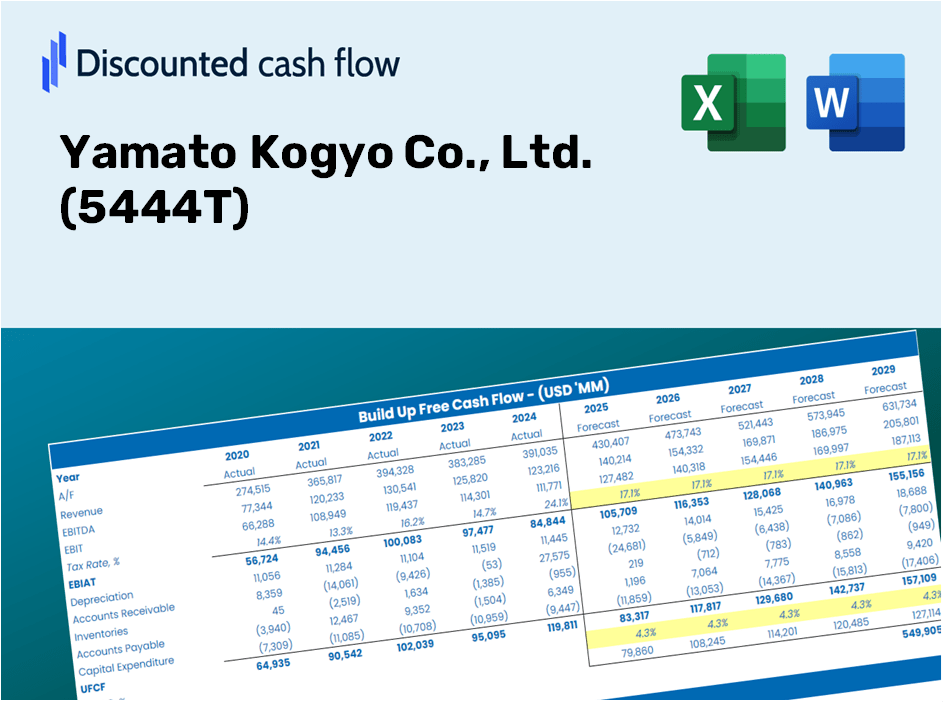
Conçu pour la précision, notre (5444t) calculatrice DCF vous permet d'évaluer la valorisation de Yamato Kogyo Co., Ltd. en utilisant des données financières réelles et une flexibilité complète pour modifier tous les paramètres essentiels pour des projections améliorées.
Discounted Cash Flow (DCF) - (USD MM)
| Year | AY1 2020 |
AY2 2021 |
AY3 2022 |
AY4 2023 |
AY5 2024 |
FY1 2025 |
FY2 2026 |
FY3 2027 |
FY4 2028 |
FY5 2029 |
|---|---|---|---|---|---|---|---|---|---|---|
| Revenue | 136,025.0 | 150,029.0 | 180,438.0 | 163,479.0 | 168,268.0 | 178,403.9 | 189,150.3 | 200,544.0 | 212,624.0 | 225,431.7 |
| Revenue Growth, % | 0 | 10.3 | 20.27 | -9.4 | 2.93 | 6.02 | 6.02 | 6.02 | 6.02 | 6.02 |
| EBITDA | 18,507.0 | 63,244.0 | 95,440.0 | 103,213.0 | 64,381.0 | 74,947.4 | 79,462.0 | 84,248.5 | 89,323.3 | 94,703.8 |
| EBITDA, % | 13.61 | 42.15 | 52.89 | 63.14 | 38.26 | 42.01 | 42.01 | 42.01 | 42.01 | 42.01 |
| Depreciation | 6,670.0 | 5,789.0 | 6,119.0 | 6,589.0 | 10,243.0 | 7,946.5 | 8,425.2 | 8,932.7 | 9,470.7 | 10,041.2 |
| Depreciation, % | 4.9 | 3.86 | 3.39 | 4.03 | 6.09 | 4.45 | 4.45 | 4.45 | 4.45 | 4.45 |
| EBIT | 11,837.0 | 57,455.0 | 89,321.0 | 96,624.0 | 54,138.0 | 67,000.9 | 71,036.8 | 75,315.8 | 79,852.6 | 84,662.6 |
| EBIT, % | 8.7 | 38.3 | 49.5 | 59.1 | 32.17 | 37.56 | 37.56 | 37.56 | 37.56 | 37.56 |
| Total Cash | 101,572.0 | 99,737.0 | 162,441.0 | 237,223.0 | 224,968.0 | 153,846.9 | 163,114.1 | 172,939.5 | 183,356.7 | 194,401.5 |
| Total Cash, percent | .0 | .0 | .0 | .0 | .0 | .0 | .0 | .0 | .0 | .0 |
| Account Receivables | 17,601.0 | 25,122.0 | 28,208.0 | 31,371.0 | 24,033.0 | 28,112.7 | 29,806.1 | 31,601.5 | 33,505.1 | 35,523.3 |
| Account Receivables, % | 12.94 | 16.74 | 15.63 | 19.19 | 14.28 | 15.76 | 15.76 | 15.76 | 15.76 | 15.76 |
| Inventories | 28,050.0 | 39,841.0 | 39,831.0 | 38,660.0 | 55,218.0 | 44,856.1 | 47,558.1 | 50,422.8 | 53,460.1 | 56,680.4 |
| Inventories, % | 20.62 | 26.56 | 22.07 | 23.65 | 32.82 | 25.14 | 25.14 | 25.14 | 25.14 | 25.14 |
| Accounts Payable | 7,528.0 | 11,033.0 | 10,592.0 | 10,851.0 | 10,197.0 | 11,223.7 | 11,899.8 | 12,616.6 | 13,376.5 | 14,182.3 |
| Accounts Payable, % | 5.53 | 7.35 | 5.87 | 6.64 | 6.06 | 6.29 | 6.29 | 6.29 | 6.29 | 6.29 |
| Capital Expenditure | -5,028.0 | -3,478.0 | -4,327.0 | -6,733.0 | -16,434.0 | -7,956.0 | -8,435.3 | -8,943.4 | -9,482.1 | -10,053.3 |
| Capital Expenditure, % | -3.7 | -2.32 | -2.4 | -4.12 | -9.77 | -4.46 | -4.46 | -4.46 | -4.46 | -4.46 |
| Tax Rate, % | 40.92 | 40.92 | 40.92 | 40.92 | 40.92 | 40.92 | 40.92 | 40.92 | 40.92 | 40.92 |
| EBITAT | 5,012.4 | 39,974.1 | 65,379.9 | 70,086.9 | 31,984.7 | 42,442.6 | 44,999.2 | 47,709.8 | 50,583.7 | 53,630.7 |
| Depreciation | ||||||||||
| Changes in Account Receivables | ||||||||||
| Changes in Inventories | ||||||||||
| Changes in Accounts Payable | ||||||||||
| Capital Expenditure | ||||||||||
| UFCF | -31,468.6 | 26,478.1 | 63,654.9 | 68,209.9 | 15,919.7 | 49,741.9 | 41,269.8 | 43,755.8 | 46,391.5 | 49,185.9 |
| WACC, % | 5.51 | 5.52 | 5.52 | 5.52 | 5.51 | 5.52 | 5.52 | 5.52 | 5.52 | 5.52 |
| PV UFCF | ||||||||||
| SUM PV UFCF | 196,490.8 | |||||||||
| Long Term Growth Rate, % | 2.00 | |||||||||
| Free cash flow (T + 1) | 50,170 | |||||||||
| Terminal Value | 1,427,261 | |||||||||
| Present Terminal Value | 1,091,265 | |||||||||
| Enterprise Value | 1,287,756 | |||||||||
| Net Debt | -223,012 | |||||||||
| Equity Value | 1,510,768 | |||||||||
| Diluted Shares Outstanding, MM | 63 | |||||||||
| Equity Value Per Share | 23,848.33 |
Benefits You Will Receive
- Pre-Configured Financial Model: Leverage Yamato Kogyo's actual data for accurate DCF valuations.
- Comprehensive Forecast Flexibility: Modify revenue growth, profit margins, WACC, and other essential factors.
- Immediate Calculations: Live updates ensure results reflect your adjustments in real time.
- Professional-Grade Template: A polished Excel file crafted for high-quality valuation presentations.
- Adaptable and Multi-Use: Designed for versatility, allowing for repeated and detailed forecasting.
Key Features
- Integrated Historical Data: Access Yamato Kogyo’s historical financial statements and pre-filled projections.
- Customizable Parameters: Adjust WACC, tax rates, revenue growth, and EBITDA margins to fit your analysis.
- Real-Time Insights: Watch Yamato Kogyo’s intrinsic value update instantly as you modify inputs.
- Intuitive Visualizations: Dashboard charts provide clear displays of valuation outcomes and crucial metrics.
- Designed for Precision: A professional-grade tool tailored for analysts, investors, and finance professionals.
How It Functions
- Download: Obtain the pre-configured Excel file containing Yamato Kogyo Co., Ltd.'s financial data.
- Customize: Modify projections, such as revenue growth, EBITDA margin, and WACC.
- Real-Time Updates: The intrinsic value and NPV calculations refresh automatically.
- Scenario Testing: Generate various projections and compare results without delay.
- Informed Decisions: Leverage the valuation outcomes to inform your investment approach.
Why Opt for Yamato Kogyo’s Calculator?
- All-in-One Solution: Features DCF, WACC, and financial ratio assessments in a single platform.
- Flexible Inputs: Modify the yellow-highlighted fields to explore different scenarios.
- In-Depth Analysis: Automatically computes Yamato Kogyo's intrinsic value and Net Present Value.
- Ready-to-Use Data: Comes with historical and forecasted information for precise calculations.
- Industry Standard: Perfect for financial analysts, investors, and business advisors.
Who Should Use Yamato Kogyo Co., Ltd. (5444T)?
- Individual Investors: Gain insights to make informed decisions about trading shares of Yamato Kogyo Co., Ltd. (5444T).
- Financial Analysts: Enhance your valuation workflows with ready-to-implement financial models tailored for Yamato Kogyo Co., Ltd. (5444T).
- Consultants: Provide clients with accurate and timely valuation insights regarding Yamato Kogyo Co., Ltd. (5444T).
- Business Owners: Learn from the valuation methods of established firms like Yamato Kogyo Co., Ltd. (5444T) to better inform your own business strategy.
- Finance Students: Explore valuation concepts using real-life data and examples from Yamato Kogyo Co., Ltd. (5444T).
Contents of the Template
- Operating and Balance Sheet Data: Pre-filled historical data and forecasts for Yamato Kogyo Co., Ltd. (5444T), including metrics such as revenue, EBITDA, EBIT, and capital expenditures.
- WACC Calculation: A dedicated worksheet for calculating the Weighted Average Cost of Capital (WACC), featuring key inputs like Beta, risk-free rate, and share price.
- DCF Valuation (Unlevered and Levered): Customizable Discounted Cash Flow models that illustrate intrinsic value with comprehensive calculations.
- Financial Statements: Pre-loaded annual and quarterly financial statements to facilitate thorough analysis.
- Key Ratios: A collection of profitability, leverage, and efficiency ratios specifically for Yamato Kogyo Co., Ltd. (5444T).
- Dashboard and Charts: A visual overview of valuation results and key assumptions for easier analysis of the findings.
Disclaimer
All information, articles, and product details provided on this website are for general informational and educational purposes only. We do not claim any ownership over, nor do we intend to infringe upon, any trademarks, copyrights, logos, brand names, or other intellectual property mentioned or depicted on this site. Such intellectual property remains the property of its respective owners, and any references here are made solely for identification or informational purposes, without implying any affiliation, endorsement, or partnership.
We make no representations or warranties, express or implied, regarding the accuracy, completeness, or suitability of any content or products presented. Nothing on this website should be construed as legal, tax, investment, financial, medical, or other professional advice. In addition, no part of this site—including articles or product references—constitutes a solicitation, recommendation, endorsement, advertisement, or offer to buy or sell any securities, franchises, or other financial instruments, particularly in jurisdictions where such activity would be unlawful.
All content is of a general nature and may not address the specific circumstances of any individual or entity. It is not a substitute for professional advice or services. Any actions you take based on the information provided here are strictly at your own risk. You accept full responsibility for any decisions or outcomes arising from your use of this website and agree to release us from any liability in connection with your use of, or reliance upon, the content or products found herein.