
|
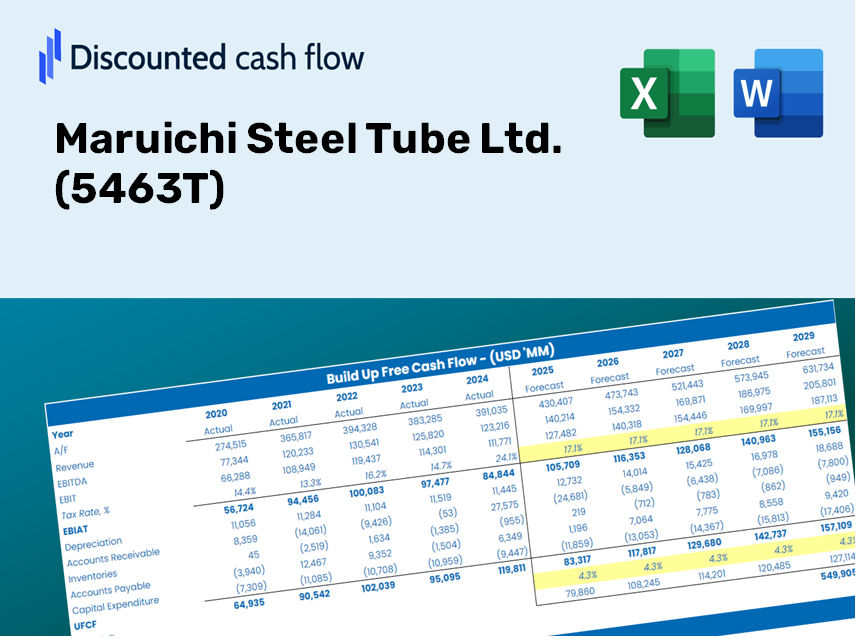
Maruichi Steel Tube Ltd. (5463.T) Évaluation DCF |
Entièrement Modifiable: Adapté À Vos Besoins Dans Excel Ou Sheets
Conception Professionnelle: Modèles Fiables Et Conformes Aux Normes Du Secteur
Pré-Construits Pour Une Utilisation Rapide Et Efficace
Compatible MAC/PC, entièrement débloqué
Aucune Expertise N'Est Requise; Facile À Suivre
Maruichi Steel Tube Ltd. (5463.T) Bundle
Rationalisez votre analyse et améliorez la précision avec notre (5463T) Calculator DCF! En utilisant les données réelles Maruichi Steel Tube Ltd.
Discounted Cash Flow (DCF) - (USD MM)
| Year | AY1 2021 |
AY2 2022 |
AY3 2023 |
AY4 2024 |
AY5 2025 |
FY1 2026 |
FY2 2027 |
FY3 2028 |
FY4 2029 |
FY5 2030 |
|---|---|---|---|---|---|---|---|---|---|---|
| Revenue | 161,138.0 | 224,218.0 | 273,416.0 | 271,310.0 | 261,649.0 | 260,249.5 | 258,857.5 | 257,472.9 | 256,095.7 | 254,725.9 |
| Revenue Growth, % | 0 | 39.15 | 21.94 | -0.77025 | -3.56 | -0.53488 | -0.53488 | -0.53488 | -0.53488 | -0.53488 |
| EBITDA | 26,585.0 | 44,301.0 | 40,828.0 | 45,081.0 | 47,959.0 | 44,832.9 | 44,593.1 | 44,354.5 | 44,117.3 | 43,881.3 |
| EBITDA, % | 16.5 | 19.76 | 14.93 | 16.62 | 18.33 | 17.23 | 17.23 | 17.23 | 17.23 | 17.23 |
| Depreciation | 5,922.0 | 5,950.0 | 6,356.0 | 6,588.0 | 7,421.0 | 7,244.3 | 7,205.5 | 7,167.0 | 7,128.6 | 7,090.5 |
| Depreciation, % | 3.68 | 2.65 | 2.32 | 2.43 | 2.84 | 2.78 | 2.78 | 2.78 | 2.78 | 2.78 |
| EBIT | 20,663.0 | 38,351.0 | 34,472.0 | 38,493.0 | 40,538.0 | 37,588.6 | 37,387.6 | 37,187.6 | 36,988.7 | 36,790.8 |
| EBIT, % | 12.82 | 17.1 | 12.61 | 14.19 | 15.49 | 14.44 | 14.44 | 14.44 | 14.44 | 14.44 |
| Total Cash | 97,421.0 | 84,239.0 | 100,157.0 | 105,374.0 | 117,330.0 | 113,646.5 | 113,038.6 | 112,434.0 | 111,832.6 | 111,234.4 |
| Total Cash, percent | .0 | .0 | .0 | .0 | .0 | .0 | .0 | .0 | .0 | .0 |
| Account Receivables | 38,973.0 | 51,980.0 | 54,292.0 | 56,601.0 | 51,164.0 | 56,027.7 | 55,728.1 | 55,430.0 | 55,133.5 | 54,838.6 |
| Account Receivables, % | 24.19 | 23.18 | 19.86 | 20.86 | 19.55 | 21.53 | 21.53 | 21.53 | 21.53 | 21.53 |
| Inventories | 31,927.0 | 54,201.0 | 60,560.0 | 57,850.0 | 54,889.0 | 56,441.2 | 56,139.3 | 55,839.1 | 55,540.4 | 55,243.3 |
| Inventories, % | 19.81 | 24.17 | 22.15 | 21.32 | 20.98 | 21.69 | 21.69 | 21.69 | 21.69 | 21.69 |
| Accounts Payable | 23,049.0 | 34,477.0 | 33,832.0 | 30,204.0 | 24,757.0 | 32,608.6 | 32,434.2 | 32,260.7 | 32,088.2 | 31,916.6 |
| Accounts Payable, % | 14.3 | 15.38 | 12.37 | 11.13 | 9.46 | 12.53 | 12.53 | 12.53 | 12.53 | 12.53 |
| Capital Expenditure | -6,267.0 | -6,835.0 | -6,634.0 | -15,737.0 | -24,638.0 | -12,794.2 | -12,725.8 | -12,657.7 | -12,590.0 | -12,522.7 |
| Capital Expenditure, % | -3.89 | -3.05 | -2.43 | -5.8 | -9.42 | -4.92 | -4.92 | -4.92 | -4.92 | -4.92 |
| Tax Rate, % | 33.18 | 33.18 | 33.18 | 33.18 | 33.18 | 33.18 | 33.18 | 33.18 | 33.18 | 33.18 |
| EBITAT | 13,961.1 | 27,839.9 | 24,313.5 | 26,204.9 | 27,087.1 | 25,980.1 | 25,841.2 | 25,702.9 | 25,565.5 | 25,428.7 |
| Depreciation | ||||||||||
| Changes in Account Receivables | ||||||||||
| Changes in Inventories | ||||||||||
| Changes in Accounts Payable | ||||||||||
| Capital Expenditure | ||||||||||
| UFCF | -34,234.9 | 3,101.9 | 14,719.5 | 13,828.9 | 12,821.1 | 21,865.8 | 20,748.0 | 20,637.0 | 20,526.7 | 20,416.9 |
| WACC, % | 4.51 | 4.51 | 4.51 | 4.51 | 4.51 | 4.51 | 4.51 | 4.51 | 4.51 | 4.51 |
| PV UFCF | ||||||||||
| SUM PV UFCF | 91,580.0 | |||||||||
| Long Term Growth Rate, % | 2.00 | |||||||||
| Free cash flow (T + 1) | 20,825 | |||||||||
| Terminal Value | 829,805 | |||||||||
| Present Terminal Value | 665,571 | |||||||||
| Enterprise Value | 757,151 | |||||||||
| Net Debt | -96,554 | |||||||||
| Equity Value | 853,705 | |||||||||
| Diluted Shares Outstanding, MM | 240 | |||||||||
| Equity Value Per Share | 3,558.44 |
What You Will Receive
- Authentic Maruichi Steel Tube Financials: Access historical and projected data for precise valuation.
- Customizable Inputs: Adjust WACC, tax rates, revenue growth, and capital expenditures to fit your analysis.
- Real-Time Calculations: Intrinsic value and NPV are computed automatically and updated as you modify inputs.
- Scenario Analysis: Explore various scenarios to assess the future performance of Maruichi Steel Tube Ltd. (5463T).
- User-Friendly Design: Crafted for industry professionals while remaining accessible to newcomers.
Key Features
- Genuine Maruichi Steel Data: Gain access to precise pre-loaded historical figures and future forecasts for Maruichi Steel Tube Ltd. (5463T).
- Adjustable Forecast Parameters: Modify the yellow-highlighted fields such as WACC, growth rates, and profit margins to tailor your analysis.
- Automated Calculations: Real-time updates for DCF, Net Present Value (NPV), and cash flow assessments.
- Interactive Dashboard: User-friendly charts and summaries that effectively display your valuation outcomes.
- Designed for All Skill Levels: A straightforward, intuitive framework suitable for investors, CFOs, and consultants alike.
How It Functions
- Step 1: Download the Excel file.
- Step 2: Examine Maruichi Steel Tube Ltd.'s pre-filled financial data and projections.
- Step 3: Adjust key inputs such as revenue growth, WACC, and tax rates (highlighted cells).
- Step 4: Observe the DCF model update in real-time as you modify your assumptions.
- Step 5: Evaluate the outputs and apply the findings to inform your investment strategies.
Why Opt for This Calculator?
- Designed for Experts: A sophisticated tool utilized by analysts, CFOs, and industry consultants.
- Comprehensive Data: Maruichi Steel Tube Ltd.’s (5463T) historical and forecasted financials are preloaded for precision.
- Flexible Scenario Analysis: Effortlessly model various forecasts and assumptions.
- Concise Results: Automatically computes intrinsic value, NPV, and essential metrics.
- User-Friendly: Step-by-step guidance makes the process straightforward.
Who Would Benefit from This Product?
- Investors: Accurately assess the fair value of Maruichi Steel Tube Ltd. (5463T) before making investment choices.
- CFOs: Utilize a high-quality DCF model for comprehensive financial reporting and analysis.
- Consultants: Easily customize the template for client valuation reports.
- Entrepreneurs: Acquire knowledge of financial modeling practices used by major corporations.
- Educators: Implement it as a resource to teach valuation techniques.
Contents of the Template
- Pre-Filled Data: Contains Maruichi Steel Tube Ltd.'s historical financials and projections.
- Discounted Cash Flow Model: Customizable DCF valuation model featuring automatic calculations.
- Weighted Average Cost of Capital (WACC): A dedicated worksheet for WACC calculations based on user-defined inputs.
- Key Financial Ratios: Assess Maruichi Steel Tube Ltd.'s profitability, efficiency, and leverage.
- Customizable Inputs: Easily modify revenue growth rates, margins, and tax percentages.
- Clear Dashboard: Visuals and tables presenting key valuation outcomes.
Disclaimer
All information, articles, and product details provided on this website are for general informational and educational purposes only. We do not claim any ownership over, nor do we intend to infringe upon, any trademarks, copyrights, logos, brand names, or other intellectual property mentioned or depicted on this site. Such intellectual property remains the property of its respective owners, and any references here are made solely for identification or informational purposes, without implying any affiliation, endorsement, or partnership.
We make no representations or warranties, express or implied, regarding the accuracy, completeness, or suitability of any content or products presented. Nothing on this website should be construed as legal, tax, investment, financial, medical, or other professional advice. In addition, no part of this site—including articles or product references—constitutes a solicitation, recommendation, endorsement, advertisement, or offer to buy or sell any securities, franchises, or other financial instruments, particularly in jurisdictions where such activity would be unlawful.
All content is of a general nature and may not address the specific circumstances of any individual or entity. It is not a substitute for professional advice or services. Any actions you take based on the information provided here are strictly at your own risk. You accept full responsibility for any decisions or outcomes arising from your use of this website and agree to release us from any liability in connection with your use of, or reliance upon, the content or products found herein.