
|
Mitsui Mining & Smelting Co., Ltd. (5706.T) Évaluation DCF |
Entièrement Modifiable: Adapté À Vos Besoins Dans Excel Ou Sheets
Conception Professionnelle: Modèles Fiables Et Conformes Aux Normes Du Secteur
Pré-Construits Pour Une Utilisation Rapide Et Efficace
Compatible MAC/PC, entièrement débloqué
Aucune Expertise N'Est Requise; Facile À Suivre
Mitsui Mining & Smelting Co., Ltd. (5706.T) Bundle
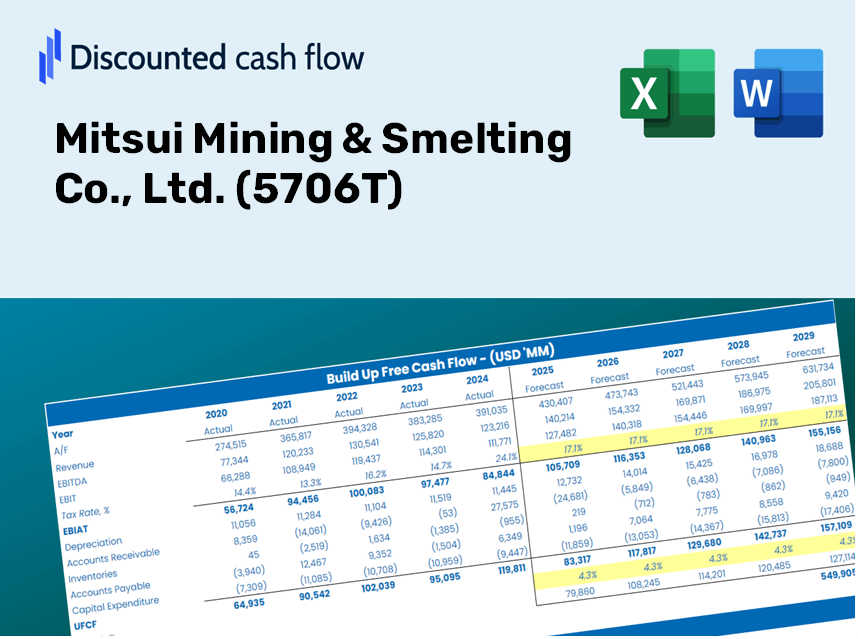
Gardez un aperçu de votre mitsui & Analyse d'évaluation de Smelting Co., Ltd. (5706T) utilisant notre calculatrice innovante DCF! Ce modèle Excel est préchargé avec des données précises (5706T), vous permettant d'ajuster les prévisions et les hypothèses pour déterminer précisément la valeur intrinsèque de l'exploitation mitsui & Smelting Co., Ltd.
Discounted Cash Flow (DCF) - (USD MM)
| Year | AY1 2021 |
AY2 2022 |
AY3 2023 |
AY4 2024 |
AY5 2025 |
FY1 2026 |
FY2 2027 |
FY3 2028 |
FY4 2029 |
FY5 2030 |
|---|---|---|---|---|---|---|---|---|---|---|
| Revenue | 522,936.0 | 633,346.0 | 651,965.0 | 646,697.0 | 712,344.0 | 771,818.3 | 836,258.1 | 906,078.0 | 981,727.3 | 1,063,692.6 |
| Revenue Growth, % | 0 | 21.11 | 2.94 | -0.80802 | 10.15 | 8.35 | 8.35 | 8.35 | 8.35 | 8.35 |
| EBITDA | 90,368.0 | 99,672.0 | 50,986.0 | 75,597.0 | 116,575.0 | 106,346.2 | 115,225.2 | 124,845.4 | 135,268.9 | 146,562.6 |
| EBITDA, % | 17.28 | 15.74 | 7.82 | 11.69 | 16.36 | 13.78 | 13.78 | 13.78 | 13.78 | 13.78 |
| Depreciation | 34,022.0 | 33,307.0 | 33,786.0 | 34,527.0 | 33,191.0 | 41,593.9 | 45,066.6 | 48,829.3 | 52,906.1 | 57,323.3 |
| Depreciation, % | 6.51 | 5.26 | 5.18 | 5.34 | 4.66 | 5.39 | 5.39 | 5.39 | 5.39 | 5.39 |
| EBIT | 56,346.0 | 66,365.0 | 17,200.0 | 41,070.0 | 83,384.0 | 64,752.3 | 70,158.5 | 76,016.1 | 82,362.8 | 89,239.3 |
| EBIT, % | 10.77 | 10.48 | 2.64 | 6.35 | 11.71 | 8.39 | 8.39 | 8.39 | 8.39 | 8.39 |
| Total Cash | 30,413.0 | 29,615.0 | 26,817.0 | 32,483.0 | 44,469.0 | 39,934.8 | 43,268.9 | 46,881.5 | 50,795.7 | 55,036.7 |
| Total Cash, percent | .0 | .0 | .0 | .0 | .0 | .0 | .0 | .0 | .0 | .0 |
| Account Receivables | 113,016.0 | 121,964.0 | 110,810.0 | 115,144.0 | 119,866.0 | 142,782.0 | 154,703.0 | 167,619.3 | 181,613.9 | 196,777.1 |
| Account Receivables, % | 21.61 | 19.26 | 17 | 17.8 | 16.83 | 18.5 | 18.5 | 18.5 | 18.5 | 18.5 |
| Inventories | 150,132.0 | 177,474.0 | 176,250.0 | 165,231.0 | 179,297.0 | 207,595.6 | 224,927.9 | 243,707.3 | 264,054.7 | 286,100.9 |
| Inventories, % | 28.71 | 28.02 | 27.03 | 25.55 | 25.17 | 26.9 | 26.9 | 26.9 | 26.9 | 26.9 |
| Accounts Payable | 45,660.0 | 61,073.0 | 56,208.0 | 50,326.0 | 48,048.0 | 64,096.1 | 69,447.5 | 75,245.7 | 81,528.1 | 88,334.9 |
| Accounts Payable, % | 8.73 | 9.64 | 8.62 | 7.78 | 6.75 | 8.3 | 8.3 | 8.3 | 8.3 | 8.3 |
| Capital Expenditure | -28,572.0 | -25,488.0 | -31,150.0 | -31,603.0 | -30,999.0 | -36,282.4 | -39,311.6 | -42,593.8 | -46,150.0 | -50,003.1 |
| Capital Expenditure, % | -5.46 | -4.02 | -4.78 | -4.89 | -4.35 | -4.7 | -4.7 | -4.7 | -4.7 | -4.7 |
| Tax Rate, % | 19.94 | 19.94 | 19.94 | 19.94 | 19.94 | 19.94 | 19.94 | 19.94 | 19.94 | 19.94 |
| EBITAT | 46,067.3 | 53,582.5 | 9,637.8 | 27,691.5 | 66,756.3 | 47,400.6 | 51,358.1 | 55,646.1 | 60,292.0 | 65,325.9 |
| Depreciation | ||||||||||
| Changes in Account Receivables | ||||||||||
| Changes in Inventories | ||||||||||
| Changes in Accounts Payable | ||||||||||
| Capital Expenditure | ||||||||||
| UFCF | -165,970.7 | 40,524.5 | 19,786.8 | 31,418.5 | 47,882.3 | 17,545.7 | 33,211.2 | 35,984.1 | 38,988.4 | 42,243.6 |
| WACC, % | 6.28 | 6.27 | 6.12 | 6.19 | 6.27 | 6.22 | 6.22 | 6.22 | 6.22 | 6.22 |
| PV UFCF | ||||||||||
| SUM PV UFCF | 137,829.6 | |||||||||
| Long Term Growth Rate, % | 3.20 | |||||||||
| Free cash flow (T + 1) | 43,595 | |||||||||
| Terminal Value | 1,441,435 | |||||||||
| Present Terminal Value | 1,065,793 | |||||||||
| Enterprise Value | 1,203,622 | |||||||||
| Net Debt | 123,667 | |||||||||
| Equity Value | 1,079,955 | |||||||||
| Diluted Shares Outstanding, MM | 57 | |||||||||
| Equity Value Per Share | 18,888.59 |
What You Will Receive
- Authentic 5706T Financials: Provides both historical and projected data for precise evaluation.
- Customizable Parameters: Adjust key factors such as WACC, tax rates, revenue growth, and capital expenditures.
- Instant Calculations: Intrinsic value and NPV are computed in real-time.
- Scenario Simulation: Analyze various scenarios to assess Mitsui Mining & Smelting's future outlook.
- User-Friendly Design: Designed for professionals but easy enough for beginners to navigate.
Key Features
- Comprehensive DCF Calculator: Offers detailed unlevered and levered DCF valuation models tailored for Mitsui Mining & Smelting Co., Ltd. (5706T).
- WACC Calculator: Features a pre-configured Weighted Average Cost of Capital sheet with adjustable inputs specific to Mitsui Mining & Smelting Co., Ltd. (5706T).
- Customizable Forecast Assumptions: Adjust growth rates, capital expenditures, and discount rates to fit the company's profile.
- Integrated Financial Ratios: Evaluate profitability, leverage, and efficiency ratios relevant to Mitsui Mining & Smelting Co., Ltd. (5706T).
- Intuitive Dashboard and Charts: Visual representations summarize key valuation metrics for streamlined analysis.
How It Functions
- Download: Obtain the pre-configured Excel file containing Mitsui Mining & Smelting Co., Ltd.'s (5706T) financial data.
- Customize: Tailor your forecasts, including expected revenue growth, EBITDA margin, and WACC.
- Update Automatically: Real-time calculations for intrinsic value and NPV adjust as you modify inputs.
- Test Scenarios: Generate various projections and instantly compare the results.
- Make Decisions: Leverage the valuation insights to inform your investment strategy.
Why Choose This Calculator for Mitsui Mining & Smelting Co., Ltd. (5706T)?
- User-Friendly Interface: Tailored for both novices and seasoned users.
- Customizable Inputs: Easily adjust variables to suit your financial analysis.
- Real-Time Feedback: Observe immediate changes to Mitsui’s valuation as you modify inputs.
- Preloaded Data: Comes equipped with Mitsui’s latest financial information for swift evaluations.
- Preferred by Industry Experts: Utilized by investors and analysts for making informed choices.
Who Can Benefit from Mitsui Mining & Smelting Co., Ltd. (5706T)?
- Investors: Gain insights and make informed decisions with a comprehensive analysis of Mitsui Mining & Smelting's market performance.
- Financial Analysts: Enhance your reports with ready-to-use financial models tailored for Mitsui Mining & Smelting’s operations.
- Consultants: Effortlessly customize presentations and analyses for clients interested in Mitsui Mining & Smelting’s offerings.
- Industry Enthusiasts: Explore the intricacies of mining and smelting with real-world examples from Mitsui Mining & Smelting.
- Academics and Students: Utilize this resource as a hands-on tool in courses focused on finance and resource management.
Contents of the Template
- Pre-Filled DCF Model: Mitsui Mining & Smelting Co., Ltd.'s (5706T) financial data preloaded for immediate analysis.
- WACC Calculator: Comprehensive calculations for the Weighted Average Cost of Capital tailored to Mitsui Mining & Smelting Co., Ltd. (5706T).
- Financial Ratios: Assess Mitsui Mining & Smelting Co., Ltd.’s (5706T) profitability, leverage, and efficiency metrics.
- Editable Inputs: Adjust assumptions including growth rates, profit margins, and CAPEX to fit your specific scenarios.
- Financial Statements: Access annual and quarterly reports for in-depth financial analysis of Mitsui Mining & Smelting Co., Ltd. (5706T).
- Interactive Dashboard: Visually represent key valuation metrics and results for easier interpretation.
Disclaimer
All information, articles, and product details provided on this website are for general informational and educational purposes only. We do not claim any ownership over, nor do we intend to infringe upon, any trademarks, copyrights, logos, brand names, or other intellectual property mentioned or depicted on this site. Such intellectual property remains the property of its respective owners, and any references here are made solely for identification or informational purposes, without implying any affiliation, endorsement, or partnership.
We make no representations or warranties, express or implied, regarding the accuracy, completeness, or suitability of any content or products presented. Nothing on this website should be construed as legal, tax, investment, financial, medical, or other professional advice. In addition, no part of this site—including articles or product references—constitutes a solicitation, recommendation, endorsement, advertisement, or offer to buy or sell any securities, franchises, or other financial instruments, particularly in jurisdictions where such activity would be unlawful.
All content is of a general nature and may not address the specific circumstances of any individual or entity. It is not a substitute for professional advice or services. Any actions you take based on the information provided here are strictly at your own risk. You accept full responsibility for any decisions or outcomes arising from your use of this website and agree to release us from any liability in connection with your use of, or reliance upon, the content or products found herein.