
|
Mitsubishi Material Corporation (5711.T) Évaluation DCF |
Entièrement Modifiable: Adapté À Vos Besoins Dans Excel Ou Sheets
Conception Professionnelle: Modèles Fiables Et Conformes Aux Normes Du Secteur
Pré-Construits Pour Une Utilisation Rapide Et Efficace
Compatible MAC/PC, entièrement débloqué
Aucune Expertise N'Est Requise; Facile À Suivre
Mitsubishi Materials Corporation (5711.T) Bundle
En tant qu'investisseur ou analyste, cette calculatrice DCF de Mitsubishi Materials Corporation (5711T) est votre ressource incontournable pour une évaluation précise. Chargé de données réelles de Mitsubishi Materials Corporation, vous pouvez ajuster les prévisions et observer instantanément les effets.
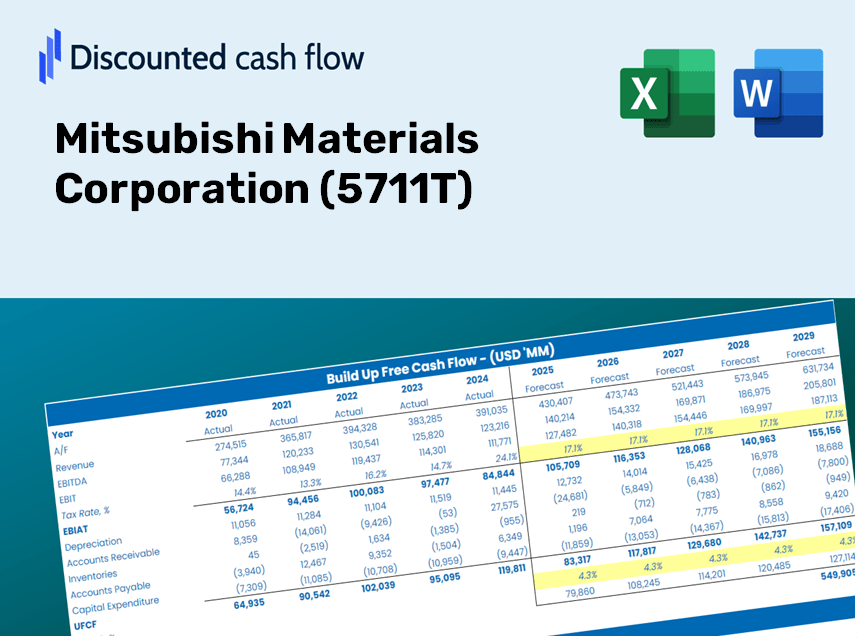
Discounted Cash Flow (DCF) - (USD MM)
| Year | AY1 2021 |
AY2 2022 |
AY3 2023 |
AY4 2024 |
AY5 2025 |
FY1 2026 |
FY2 2027 |
FY3 2028 |
FY4 2029 |
FY5 2030 |
|---|---|---|---|---|---|---|---|---|---|---|
| Revenue | 1,485,121.0 | 1,811,759.0 | 1,625,933.0 | 1,540,642.0 | 1,962,076.0 | 2,010,640.5 | 2,060,407.0 | 2,111,405.3 | 2,163,665.9 | 2,217,220.0 |
| Revenue Growth, % | 0 | 21.99 | -10.26 | -5.25 | 27.35 | 2.48 | 2.48 | 2.48 | 2.48 | 2.48 |
| EBITDA | 114,093.0 | 150,203.0 | 66,867.0 | 102,240.0 | 106,020.0 | 129,183.8 | 132,381.3 | 135,658.0 | 139,015.7 | 142,456.6 |
| EBITDA, % | 7.68 | 8.29 | 4.11 | 6.64 | 5.4 | 6.43 | 6.43 | 6.43 | 6.43 | 6.43 |
| Depreciation | 66,336.0 | 68,089.0 | 46,082.0 | 48,443.0 | 47,284.0 | 66,806.7 | 68,460.3 | 70,154.8 | 71,891.3 | 73,670.7 |
| Depreciation, % | 4.47 | 3.76 | 2.83 | 3.14 | 2.41 | 3.32 | 3.32 | 3.32 | 3.32 | 3.32 |
| EBIT | 47,757.0 | 82,114.0 | 20,785.0 | 53,797.0 | 58,736.0 | 62,377.1 | 63,921.0 | 65,503.1 | 67,124.4 | 68,785.9 |
| EBIT, % | 3.22 | 4.53 | 1.28 | 3.49 | 2.99 | 3.1 | 3.1 | 3.1 | 3.1 | 3.1 |
| Total Cash | 153,086.0 | 159,221.0 | 142,126.0 | 134,923.0 | 91,605.0 | 165,933.1 | 170,040.2 | 174,249.0 | 178,561.9 | 182,981.6 |
| Total Cash, percent | .0 | .0 | .0 | .0 | .0 | .0 | .0 | .0 | .0 | .0 |
| Account Receivables | 373,673.0 | 442,834.0 | 423,394.0 | 497,409.0 | 657,551.0 | 568,779.0 | 582,857.2 | 597,283.8 | 612,067.5 | 627,217.1 |
| Account Receivables, % | 25.16 | 24.44 | 26.04 | 32.29 | 33.51 | 28.29 | 28.29 | 28.29 | 28.29 | 28.29 |
| Inventories | 379,874.0 | 454,595.0 | 377,674.0 | 428,500.0 | 483,429.0 | 508,088.4 | 520,664.4 | 533,551.6 | 546,757.9 | 560,291.0 |
| Inventories, % | 25.58 | 25.09 | 23.23 | 27.81 | 24.64 | 25.27 | 25.27 | 25.27 | 25.27 | 25.27 |
| Accounts Payable | 153,603.0 | 158,534.0 | 85,211.0 | 85,211.0 | 99,426.0 | 140,471.7 | 143,948.6 | 147,511.6 | 151,162.7 | 154,904.2 |
| Accounts Payable, % | 10.34 | 8.75 | 5.24 | 5.53 | 5.07 | 6.99 | 6.99 | 6.99 | 6.99 | 6.99 |
| Capital Expenditure | -78,727.0 | -78,162.0 | -76,712.0 | -82,954.0 | -56,077.0 | -90,783.0 | -93,030.1 | -95,332.7 | -97,692.3 | -100,110.4 |
| Capital Expenditure, % | -5.3 | -4.31 | -4.72 | -5.38 | -2.86 | -4.52 | -4.52 | -4.52 | -4.52 | -4.52 |
| Tax Rate, % | 31.8 | 31.8 | 31.8 | 31.8 | 31.8 | 31.8 | 31.8 | 31.8 | 31.8 | 31.8 |
| EBITAT | 26,893.8 | 48,245.3 | 28,607.3 | 34,820.2 | 40,060.6 | 43,414.1 | 44,488.7 | 45,589.9 | 46,718.3 | 47,874.6 |
| Depreciation | ||||||||||
| Changes in Account Receivables | ||||||||||
| Changes in Inventories | ||||||||||
| Changes in Accounts Payable | ||||||||||
| Capital Expenditure | ||||||||||
| UFCF | -585,441.2 | -100,778.7 | 21,015.3 | -124,531.8 | -169,588.4 | 124,596.2 | -3,258.3 | -3,338.9 | -3,421.6 | -3,506.3 |
| WACC, % | 3.42 | 3.47 | 4.37 | 3.6 | 3.68 | 3.71 | 3.71 | 3.71 | 3.71 | 3.71 |
| PV UFCF | ||||||||||
| SUM PV UFCF | 108,239.3 | |||||||||
| Long Term Growth Rate, % | 3.20 | |||||||||
| Free cash flow (T + 1) | -3,618 | |||||||||
| Terminal Value | -714,934 | |||||||||
| Present Terminal Value | -595,996 | |||||||||
| Enterprise Value | -487,757 | |||||||||
| Net Debt | 501,493 | |||||||||
| Equity Value | -989,250 | |||||||||
| Diluted Shares Outstanding, MM | 131 | |||||||||
| Equity Value Per Share | -7,571.58 |
What You Will Receive
- Adjustable Forecast Assumptions: Effortlessly modify factors (growth %, margins, WACC) to explore various scenarios.
- Comprehensive Financial Data: Mitsubishi Materials Corporation’s (5711T) financial data pre-loaded to expedite your analysis.
- Automated DCF Calculations: The template swiftly computes Net Present Value (NPV) and intrinsic value for you.
- Tailored and Professional Design: A refined Excel model that can be customized to suit your valuation requirements.
- Designed for Analysts and Investors: Perfect for testing forecasts, validating strategies, and enhancing efficiency.
Key Features
- Actual Mitsubishi Materials Data: Pre-filled with historical financial information and forward-looking estimates specific to Mitsubishi Materials Corporation (5711T).
- Completely Customizable Variables: Tailor revenue growth rates, profit margins, WACC, tax rates, and capital expenditure figures to your needs.
- Dynamic Valuation Framework: Automatic recalculations of Net Present Value (NPV) and intrinsic value in response to your input adjustments.
- Scenario Analysis: Generate various forecasting scenarios to evaluate different valuation results.
- User-Friendly Interface: Intuitive and organized design suitable for both industry professionals and newcomers.
How It Operates
- Step 1: Download the Excel spreadsheet.
- Step 2: Examine the pre-filled Mitsubishi Materials data (historical and forecasted).
- Step 3: Modify key assumptions (highlighted cells) according to your analysis.
- Step 4: Observe automatic recalculations for Mitsubishi Materials’ intrinsic value.
- Step 5: Utilize the results for investment strategies or reporting purposes.
Why Opt for This Calculator?
- Precision: Utilizes authentic Mitsubishi Materials Corporation (5711T) financial data for reliable results.
- Versatility: Created to allow users to experiment with and adjust inputs effortlessly.
- Efficiency: Avoid the complexities of constructing a DCF model from the ground up.
- Expert-Level: Engineered with the accuracy and functionality expected at the CFO level.
- Accessible: Intuitive design ensures ease of use, even for those lacking advanced financial modeling skills.
Who Should Use This Product?
- Individual Investors: Gain insights to make informed decisions regarding the buying or selling of Mitsubishi Materials Corporation (5711T) shares.
- Financial Analysts: Enhance your valuation methods with efficient financial models tailored for Mitsubishi Materials Corporation (5711T).
- Consultants: Provide clients with professional and accurate valuation insights related to Mitsubishi Materials Corporation (5711T) in a timely manner.
- Business Owners: Learn how companies like Mitsubishi Materials Corporation (5711T) are valued to inform your own strategic initiatives.
- Finance Students: Explore valuation techniques through the lens of real-world data involving Mitsubishi Materials Corporation (5711T).
What the Template Includes
- Pre-Filled DCF Model: Mitsubishi Materials Corporation’s (5711T) financial data preloaded for immediate application.
- WACC Calculator: Comprehensive calculations for Weighted Average Cost of Capital.
- Financial Ratios: Assess Mitsubishi Materials Corporation’s profitability, leverage, and operational efficiency.
- Editable Inputs: Modify assumptions like growth rates, margins, and CAPEX to suit your analysis.
- Financial Statements: Access annual and quarterly reports for in-depth evaluation.
- Interactive Dashboard: Effortlessly visualize key valuation metrics and outcomes.
Disclaimer
All information, articles, and product details provided on this website are for general informational and educational purposes only. We do not claim any ownership over, nor do we intend to infringe upon, any trademarks, copyrights, logos, brand names, or other intellectual property mentioned or depicted on this site. Such intellectual property remains the property of its respective owners, and any references here are made solely for identification or informational purposes, without implying any affiliation, endorsement, or partnership.
We make no representations or warranties, express or implied, regarding the accuracy, completeness, or suitability of any content or products presented. Nothing on this website should be construed as legal, tax, investment, financial, medical, or other professional advice. In addition, no part of this site—including articles or product references—constitutes a solicitation, recommendation, endorsement, advertisement, or offer to buy or sell any securities, franchises, or other financial instruments, particularly in jurisdictions where such activity would be unlawful.
All content is of a general nature and may not address the specific circumstances of any individual or entity. It is not a substitute for professional advice or services. Any actions you take based on the information provided here are strictly at your own risk. You accept full responsibility for any decisions or outcomes arising from your use of this website and agree to release us from any liability in connection with your use of, or reliance upon, the content or products found herein.