
|
UACJ Corporation (5741.T) Évaluation DCF |
Entièrement Modifiable: Adapté À Vos Besoins Dans Excel Ou Sheets
Conception Professionnelle: Modèles Fiables Et Conformes Aux Normes Du Secteur
Pré-Construits Pour Une Utilisation Rapide Et Efficace
Compatible MAC/PC, entièrement débloqué
Aucune Expertise N'Est Requise; Facile À Suivre
UACJ Corporation (5741.T) Bundle
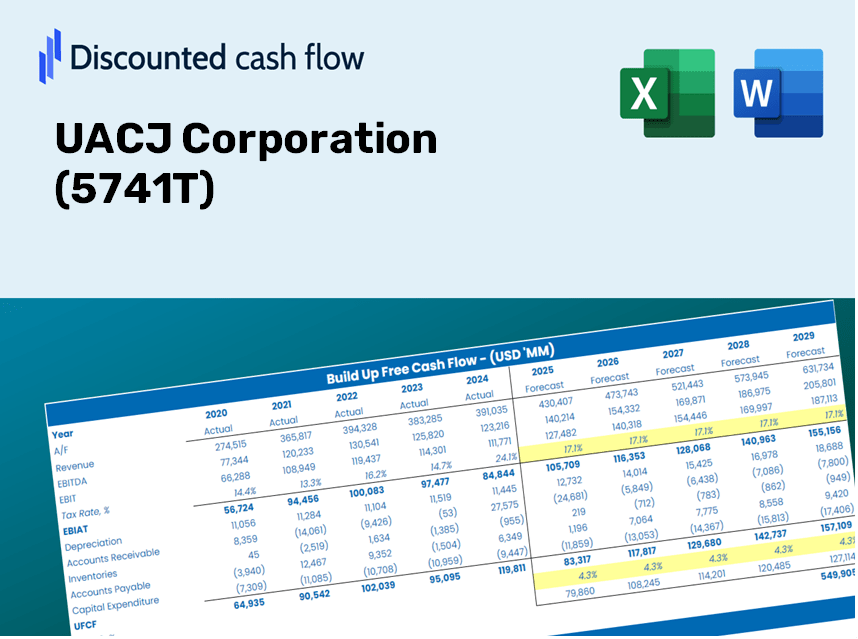
Rationalisez votre analyse et améliorez la précision avec notre (5741T) Calculator DCF! En utilisant des données authentiques d'UACJ Corporation et des hypothèses personnalisables, cet outil vous permet de prévoir, d'analyser et d'évaluer UACJ comme un investisseur chevronné.
Discounted Cash Flow (DCF) - (USD MM)
| Year | AY1 2020 |
AY2 2021 |
AY3 2022 |
AY4 2023 |
AY5 2024 |
FY1 2025 |
FY2 2026 |
FY3 2027 |
FY4 2028 |
FY5 2029 |
|---|---|---|---|---|---|---|---|---|---|---|
| Revenue | 569,756.0 | 782,911.0 | 955,717.0 | 892,781.0 | 998,781.0 | 1,160,512.8 | 1,348,433.7 | 1,566,784.4 | 1,820,492.5 | 2,115,283.3 |
| Revenue Growth, % | 0 | 37.41 | 22.07 | -6.59 | 11.87 | 16.19 | 16.19 | 16.19 | 16.19 | 16.19 |
| EBITDA | 43,221.0 | 92,019.0 | 42,902.0 | 67,913.0 | 95,168.0 | 95,077.6 | 110,473.5 | 128,362.3 | 149,148.0 | 173,299.4 |
| EBITDA, % | 7.59 | 11.75 | 4.49 | 7.61 | 9.53 | 8.19 | 8.19 | 8.19 | 8.19 | 8.19 |
| Depreciation | 33,396.0 | 34,038.0 | 34,800.0 | 36,406.0 | 38,147.0 | 50,476.5 | 58,650.1 | 68,147.3 | 79,182.3 | 92,004.2 |
| Depreciation, % | 5.86 | 4.35 | 3.64 | 4.08 | 3.82 | 4.35 | 4.35 | 4.35 | 4.35 | 4.35 |
| EBIT | 9,825.0 | 57,981.0 | 8,102.0 | 31,507.0 | 57,021.0 | 44,601.1 | 51,823.4 | 60,215.1 | 69,965.6 | 81,295.1 |
| EBIT, % | 1.72 | 7.41 | 0.84774 | 3.53 | 5.71 | 3.84 | 3.84 | 3.84 | 3.84 | 3.84 |
| Total Cash | 28,085.0 | 14,334.0 | 23,357.0 | 40,199.0 | 26,329.0 | 37,932.2 | 44,074.6 | 51,211.5 | 59,504.2 | 69,139.6 |
| Total Cash, percent | .0 | .0 | .0 | .0 | .0 | .0 | .0 | .0 | .0 | .0 |
| Account Receivables | 119,752.0 | 122,458.0 | 169,020.0 | 179,685.0 | 187,343.0 | 216,385.1 | 251,424.2 | 292,137.1 | 339,442.6 | 394,408.3 |
| Account Receivables, % | 21.02 | 15.64 | 17.69 | 20.13 | 18.76 | 18.65 | 18.65 | 18.65 | 18.65 | 18.65 |
| Inventories | 131,699.0 | 232,366.0 | 228,662.0 | 187,884.0 | 244,108.0 | 283,642.8 | 329,572.9 | 382,940.4 | 444,949.6 | 516,999.9 |
| Inventories, % | 23.11 | 29.68 | 23.93 | 21.04 | 24.44 | 24.44 | 24.44 | 24.44 | 24.44 | 24.44 |
| Accounts Payable | 101,090.0 | 118,549.0 | 117,660.0 | 141,658.0 | 140,615.0 | 174,405.7 | 202,647.1 | 235,461.5 | 273,589.6 | 317,891.8 |
| Accounts Payable, % | 17.74 | 15.14 | 12.31 | 15.87 | 14.08 | 15.03 | 15.03 | 15.03 | 15.03 | 15.03 |
| Capital Expenditure | -23,817.0 | -20,932.0 | -26,258.0 | -33,893.0 | -37,504.0 | -39,811.6 | -46,258.3 | -53,748.9 | -62,452.4 | -72,565.2 |
| Capital Expenditure, % | -4.18 | -2.67 | -2.75 | -3.8 | -3.75 | -3.43 | -3.43 | -3.43 | -3.43 | -3.43 |
| Tax Rate, % | 34.97 | 34.97 | 34.97 | 34.97 | 34.97 | 34.97 | 34.97 | 34.97 | 34.97 | 34.97 |
| EBITAT | -9,247.9 | 37,085.9 | -6,270.8 | 19,874.6 | 37,078.0 | 17,132.8 | 19,907.1 | 23,130.7 | 26,876.2 | 31,228.2 |
| Depreciation | ||||||||||
| Changes in Account Receivables | ||||||||||
| Changes in Inventories | ||||||||||
| Changes in Accounts Payable | ||||||||||
| Capital Expenditure | ||||||||||
| UFCF | -150,029.9 | -35,722.1 | -41,475.8 | 76,498.6 | -27,204.0 | -6,988.6 | -20,428.8 | -23,736.8 | -27,580.5 | -32,046.6 |
| WACC, % | 3.61 | 5.07 | 3.61 | 5.05 | 5.1 | 4.49 | 4.49 | 4.49 | 4.49 | 4.49 |
| PV UFCF | ||||||||||
| SUM PV UFCF | -95,078.2 | |||||||||
| Long Term Growth Rate, % | 3.30 | |||||||||
| Free cash flow (T + 1) | -33,104 | |||||||||
| Terminal Value | -2,787,528 | |||||||||
| Present Terminal Value | -2,238,184 | |||||||||
| Enterprise Value | -2,333,262 | |||||||||
| Net Debt | 323,224 | |||||||||
| Equity Value | -2,656,486 | |||||||||
| Diluted Shares Outstanding, MM | 191 | |||||||||
| Equity Value Per Share | -13,908.60 |
What You Will Receive
- Customizable Excel Template: An Excel-based DCF Calculator tailored for UACJ Corporation, featuring pre-loaded financial data.
- Comprehensive Data: Access to historical performance metrics and projected estimates (highlighted in the yellow cells).
- Flexible Forecasting: Adjust key assumptions such as revenue growth, EBITDA margin, and WACC to suit your analysis.
- Instant Calculations: View real-time changes in UACJ's valuation based on your input adjustments.
- Professional Insights: Designed for investors, CFOs, consultants, and financial analysts seeking in-depth analysis.
- User-Centric Layout: Organized for easy navigation and comprehension, complete with step-by-step guidance.
Key Features
- Comprehensive DCF Calculator: Offers both unlevered and levered DCF valuation models tailored for UACJ Corporation (5741T).
- WACC Calculator: Features a pre-configured Weighted Average Cost of Capital sheet with adjustable parameters.
- Customizable Forecast Assumptions: Easily alter growth rates, capital expenditures, and discount rates.
- Integrated Financial Ratios: Evaluate profitability, leverage, and efficiency ratios specific to UACJ Corporation (5741T).
- Interactive Dashboard and Charts: Visual representations to simplify the analysis of key valuation metrics.
How It Functions
- 1. Access the Template: Download and open the Excel file featuring UACJ Corporation's (5741T) preloaded data.
- 2. Modify Assumptions: Adjust key parameters such as growth rates, WACC, and capital expenditures as needed.
- 3. Instant Results: The DCF model automatically computes the intrinsic value and NPV in real-time.
- 4. Explore Scenarios: Analyze various forecasts to evaluate different valuation scenarios.
- 5. Present with Assurance: Share professional valuation insights to bolster your decision-making process.
Why Choose This Calculator for UACJ Corporation (5741T)?
- Precise Data: Utilize accurate UACJ financials for trustworthy valuation outcomes.
- Tailorable: Modify essential parameters such as growth rates, WACC, and tax rates to align with your forecasts.
- Efficiency: Built-in calculations save you the effort of starting from scratch.
- Expert-Level Tool: Crafted for investors, analysts, and consultants alike.
- Easy to Use: A user-friendly interface and step-by-step guidance cater to users of all experience levels.
Who Can Benefit from This Product?
- Investors: Evaluate UACJ Corporation’s (5741T) valuation prior to making stock transactions.
- CFOs and Financial Analysts: Enhance the efficiency of valuation processes and verify financial projections.
- Startup Founders: Gain insights into how significant public enterprises like UACJ Corporation are appraised.
- Consultants: Create comprehensive valuation reports for your clients.
- Students and Educators: Utilize current market data to teach and practice valuation methods.
Contents of the Template
- Historical Data: Comprises UACJ Corporation’s past financial performance and baseline forecasts.
- DCF and Levered DCF Models: Comprehensive templates to assess UACJ’s intrinsic value.
- WACC Sheet: Pre-configured calculations for the Weighted Average Cost of Capital.
- Editable Inputs: Adjust key variables such as growth rates, EBITDA percentages, and CAPEX estimates.
- Quarterly and Annual Statements: Detailed analysis of UACJ's financial statements.
- Interactive Dashboard: Dynamically visualize valuation results and future projections.
Disclaimer
All information, articles, and product details provided on this website are for general informational and educational purposes only. We do not claim any ownership over, nor do we intend to infringe upon, any trademarks, copyrights, logos, brand names, or other intellectual property mentioned or depicted on this site. Such intellectual property remains the property of its respective owners, and any references here are made solely for identification or informational purposes, without implying any affiliation, endorsement, or partnership.
We make no representations or warranties, express or implied, regarding the accuracy, completeness, or suitability of any content or products presented. Nothing on this website should be construed as legal, tax, investment, financial, medical, or other professional advice. In addition, no part of this site—including articles or product references—constitutes a solicitation, recommendation, endorsement, advertisement, or offer to buy or sell any securities, franchises, or other financial instruments, particularly in jurisdictions where such activity would be unlawful.
All content is of a general nature and may not address the specific circumstances of any individual or entity. It is not a substitute for professional advice or services. Any actions you take based on the information provided here are strictly at your own risk. You accept full responsibility for any decisions or outcomes arising from your use of this website and agree to release us from any liability in connection with your use of, or reliance upon, the content or products found herein.