
|
Fujikura Ltd. (5803.T) Évaluation DCF |
Entièrement Modifiable: Adapté À Vos Besoins Dans Excel Ou Sheets
Conception Professionnelle: Modèles Fiables Et Conformes Aux Normes Du Secteur
Pré-Construits Pour Une Utilisation Rapide Et Efficace
Compatible MAC/PC, entièrement débloqué
Aucune Expertise N'Est Requise; Facile À Suivre
Fujikura Ltd. (5803.T) Bundle
Découvrez la vraie valeur de Fujikura Ltd. (5803T) avec notre calculatrice avancée DCF! Ajustez les hypothèses clés, explorez divers scénarios et évaluez comment les différents changements affectent la valorisation de Fujikura Ltd. (5803T) - le tout dans un modèle Excel convivial.
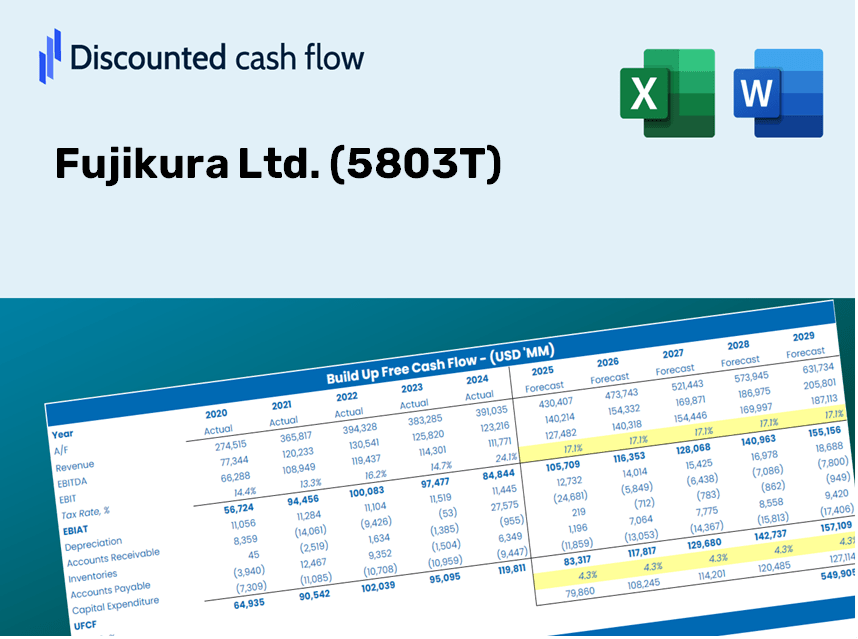
Discounted Cash Flow (DCF) - (USD MM)
| Year | AY1 2020 |
AY2 2021 |
AY3 2022 |
AY4 2023 |
AY5 2024 |
FY1 2025 |
FY2 2026 |
FY3 2027 |
FY4 2028 |
FY5 2029 |
|---|---|---|---|---|---|---|---|---|---|---|
| Revenue | 643,736.0 | 670,350.0 | 806,453.0 | 799,760.0 | 979,375.0 | 1,092,165.4 | 1,217,945.3 | 1,358,210.8 | 1,514,630.0 | 1,689,063.3 |
| Revenue Growth, % | 0 | 4.13 | 20.3 | -0.82993 | 22.46 | 11.52 | 11.52 | 11.52 | 11.52 | 11.52 |
| EBITDA | 41,634.0 | 86,302.0 | 84,037.0 | 92,195.0 | 147,527.0 | 123,094.7 | 137,271.0 | 153,079.9 | 170,709.4 | 190,369.3 |
| EBITDA, % | 6.47 | 12.87 | 10.42 | 11.53 | 15.06 | 11.27 | 11.27 | 11.27 | 11.27 | 11.27 |
| Depreciation | 35,189.0 | 31,321.0 | 30,239.0 | 24,159.0 | 22,916.0 | 42,046.1 | 46,888.4 | 52,288.3 | 58,310.2 | 65,025.5 |
| Depreciation, % | 5.47 | 4.67 | 3.75 | 3.02 | 2.34 | 3.85 | 3.85 | 3.85 | 3.85 | 3.85 |
| EBIT | 6,445.0 | 54,981.0 | 53,798.0 | 68,036.0 | 124,611.0 | 81,048.6 | 90,382.6 | 100,791.6 | 112,399.3 | 125,343.8 |
| EBIT, % | 1 | 8.2 | 6.67 | 8.51 | 12.72 | 7.42 | 7.42 | 7.42 | 7.42 | 7.42 |
| Total Cash | 74,740.0 | 91,041.0 | 107,228.0 | 147,760.0 | 184,991.0 | 165,685.7 | 184,767.0 | 206,045.8 | 229,775.2 | 256,237.4 |
| Total Cash, percent | .0 | .0 | .0 | .0 | .0 | .0 | .0 | .0 | .0 | .0 |
| Account Receivables | 122,462.0 | 144,250.0 | 154,977.0 | 163,343.0 | 202,465.0 | 220,303.4 | 245,674.8 | 273,968.1 | 305,519.8 | 340,705.2 |
| Account Receivables, % | 19.02 | 21.52 | 19.22 | 20.42 | 20.67 | 20.17 | 20.17 | 20.17 | 20.17 | 20.17 |
| Inventories | 100,466.0 | 112,632.0 | 130,992.0 | 131,527.0 | 147,205.0 | 175,026.0 | 195,183.0 | 217,661.3 | 242,728.5 | 270,682.4 |
| Inventories, % | 15.61 | 16.8 | 16.24 | 16.45 | 15.03 | 16.03 | 16.03 | 16.03 | 16.03 | 16.03 |
| Accounts Payable | 68,512.0 | 71,841.0 | 74,650.0 | 78,019.0 | 104,866.0 | 111,573.7 | 124,423.2 | 138,752.5 | 154,732.0 | 172,551.8 |
| Accounts Payable, % | 10.64 | 10.72 | 9.26 | 9.76 | 10.71 | 10.22 | 10.22 | 10.22 | 10.22 | 10.22 |
| Capital Expenditure | -18,649.0 | -15,767.0 | -15,428.0 | -20,827.0 | -29,098.0 | -27,822.6 | -31,026.8 | -34,600.0 | -38,584.8 | -43,028.4 |
| Capital Expenditure, % | -2.9 | -2.35 | -1.91 | -2.6 | -2.97 | -2.55 | -2.55 | -2.55 | -2.55 | -2.55 |
| Tax Rate, % | 24.94 | 24.94 | 24.94 | 24.94 | 24.94 | 24.94 | 24.94 | 24.94 | 24.94 | 24.94 |
| EBITAT | -29,474.6 | 41,602.6 | 43,353.7 | 54,046.3 | 93,533.2 | 50,371.9 | 56,173.0 | 62,642.2 | 69,856.4 | 77,901.5 |
| Depreciation | ||||||||||
| Changes in Account Receivables | ||||||||||
| Changes in Inventories | ||||||||||
| Changes in Accounts Payable | ||||||||||
| Capital Expenditure | ||||||||||
| UFCF | -167,350.6 | 26,531.6 | 31,886.7 | 51,846.3 | 59,398.2 | 25,643.8 | 39,355.7 | 43,888.1 | 48,942.5 | 54,579.0 |
| WACC, % | 7.29 | 7.39 | 7.39 | 7.39 | 7.39 | 7.37 | 7.37 | 7.37 | 7.37 | 7.37 |
| PV UFCF | ||||||||||
| SUM PV UFCF | 168,559.9 | |||||||||
| Long Term Growth Rate, % | 2.00 | |||||||||
| Free cash flow (T + 1) | 55,671 | |||||||||
| Terminal Value | 1,036,972 | |||||||||
| Present Terminal Value | 726,743 | |||||||||
| Enterprise Value | 895,303 | |||||||||
| Net Debt | -15,626 | |||||||||
| Equity Value | 910,929 | |||||||||
| Diluted Shares Outstanding, MM | 276 | |||||||||
| Equity Value Per Share | 3,302.05 |
Benefits You Will Receive
- Comprehensive Financial Model: Fujikura Ltd.'s actual data facilitates accurate DCF valuation.
- Complete Forecast Customization: Modify revenue growth, profit margins, WACC, and other essential factors.
- Real-Time Calculations: Automatic updates provide immediate insights as you adjust variables.
- Professional-Grade Template: A polished Excel file crafted for high-quality valuation presentations.
- Flexible and Reusable: Designed for adaptability, allowing for repeated application in detailed forecasts.
Key Features
- Authentic Fujikura Financials: Gain access to precise historical data and future forecasts specific to Fujikura Ltd. (5803T).
- Customizable Forecast Assumptions: Modify highlighted cells, such as WACC, growth rates, and profit margins.
- Dynamic Calculations: Enjoy automatic updates for DCF, Net Present Value (NPV), and cash flow analysis.
- Visual Dashboard: Utilize clear charts and summaries to effectively visualize your valuation findings.
- Suitable for All Users: Designed with an intuitive layout catering to investors, CFOs, and consultants alike.
How It Works
- Download the Template: Gain immediate access to the Excel-based Fujikura Ltd. (5803T) DCF Calculator.
- Input Your Assumptions: Modify the yellow-highlighted cells for growth rates, WACC, margins, and other parameters.
- Instant Calculations: The model will automatically refresh Fujikura Ltd.’s intrinsic value.
- Test Scenarios: Experiment with various assumptions to assess potential changes in valuation.
- Analyze and Decide: Leverage the results to inform your investment or financial analysis.
Why Opt for Fujikura Ltd. (5803T) Calculator?
- Precision: Accurate data derived from genuine Fujikura financials.
- Versatility: Built to allow users to effortlessly test and adjust inputs.
- Efficiency: Eliminate the complexities of creating a financial model from the ground up.
- Corporate-Level: Crafted with the expertise and usability expected by CFOs.
- Intuitive: Simple to navigate, perfect for those new to financial modeling.
Who Can Benefit from Fujikura Ltd. (5803T)?
- Investors: Make informed decisions with our advanced valuation tools designed for precision.
- Financial Analysts: Enhance efficiency with a customizable pre-built DCF model tailored for your needs.
- Consultants: Effortlessly modify the template for impactful client presentations and comprehensive reports.
- Finance Enthusiasts: Expand your knowledge of valuation methodologies through practical, real-world examples.
- Educators and Students: Utilize this resource as a hands-on learning tool within finance-related disciplines.
Contents of the Template
- Pre-Filled Data: Features Fujikura Ltd.'s (5803T) historical financials and projections.
- Discounted Cash Flow Model: An editable DCF valuation model with automatic computation capabilities.
- Weighted Average Cost of Capital (WACC): A dedicated worksheet for WACC calculations based on your custom inputs.
- Key Financial Ratios: Assess Fujikura Ltd.'s (5803T) profitability, efficiency, and debt management.
- Customizable Inputs: Easily modify revenue growth, profit margins, and tax rates.
- User-Friendly Dashboard: Visual charts and tables that summarize essential valuation findings.
Disclaimer
All information, articles, and product details provided on this website are for general informational and educational purposes only. We do not claim any ownership over, nor do we intend to infringe upon, any trademarks, copyrights, logos, brand names, or other intellectual property mentioned or depicted on this site. Such intellectual property remains the property of its respective owners, and any references here are made solely for identification or informational purposes, without implying any affiliation, endorsement, or partnership.
We make no representations or warranties, express or implied, regarding the accuracy, completeness, or suitability of any content or products presented. Nothing on this website should be construed as legal, tax, investment, financial, medical, or other professional advice. In addition, no part of this site—including articles or product references—constitutes a solicitation, recommendation, endorsement, advertisement, or offer to buy or sell any securities, franchises, or other financial instruments, particularly in jurisdictions where such activity would be unlawful.
All content is of a general nature and may not address the specific circumstances of any individual or entity. It is not a substitute for professional advice or services. Any actions you take based on the information provided here are strictly at your own risk. You accept full responsibility for any decisions or outcomes arising from your use of this website and agree to release us from any liability in connection with your use of, or reliance upon, the content or products found herein.