
|
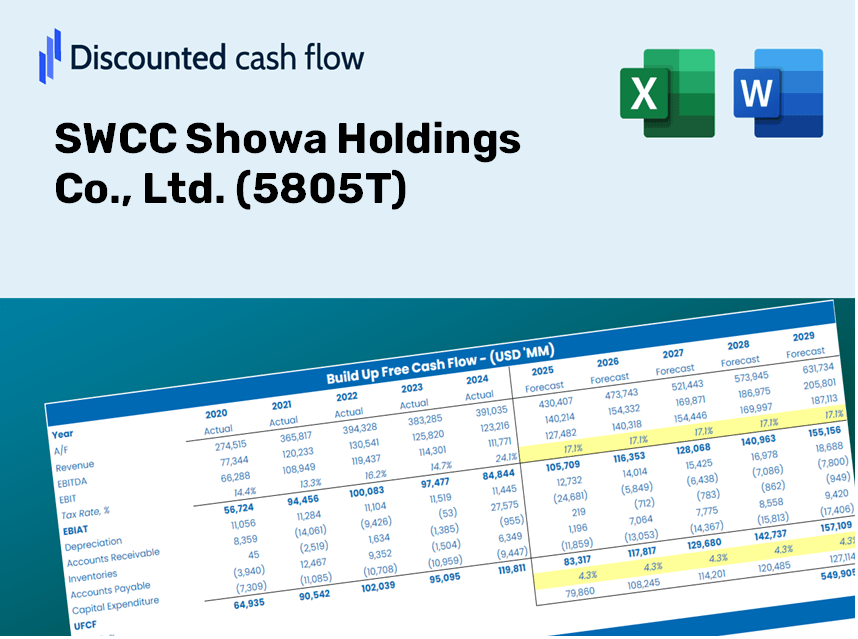
SWCC Showa Holdings Co., Ltd. (5805.T) Évaluation DCF |
Entièrement Modifiable: Adapté À Vos Besoins Dans Excel Ou Sheets
Conception Professionnelle: Modèles Fiables Et Conformes Aux Normes Du Secteur
Pré-Construits Pour Une Utilisation Rapide Et Efficace
Compatible MAC/PC, entièrement débloqué
Aucune Expertise N'Est Requise; Facile À Suivre
SWCC Showa Holdings Co., Ltd. (5805.T) Bundle
Conçu pour la précision, notre (5805T) Calculator DCF vous permet d'évaluer la valorisation SWCC Showa Holdings Co., Ltd. à l'aide de données financières réelles et offre une flexibilité complète pour modifier tous les paramètres clés pour des projections améliorées.
Discounted Cash Flow (DCF) - (USD MM)
| Year | AY1 2020 |
AY2 2021 |
AY3 2022 |
AY4 2023 |
AY5 2024 |
FY1 2025 |
FY2 2026 |
FY3 2027 |
FY4 2028 |
FY5 2029 |
|---|---|---|---|---|---|---|---|---|---|---|
| Revenue | 161,697.0 | 199,194.0 | 209,111.0 | 213,904.0 | 237,862.0 | 262,635.7 | 289,989.7 | 320,192.6 | 353,541.2 | 390,363.1 |
| Revenue Growth, % | 0 | 23.19 | 4.98 | 2.29 | 11.2 | 10.42 | 10.42 | 10.42 | 10.42 | 10.42 |
| EBITDA | 10,311.0 | 15,020.0 | 16,773.0 | 17,324.0 | 25,163.0 | 21,334.4 | 23,556.4 | 26,009.9 | 28,718.9 | 31,710.0 |
| EBITDA, % | 6.38 | 7.54 | 8.02 | 8.1 | 10.58 | 8.12 | 8.12 | 8.12 | 8.12 | 8.12 |
| Depreciation | 3,183.0 | 3,345.0 | 3,497.0 | 3,638.0 | 3,903.0 | 4,549.8 | 5,023.6 | 5,546.8 | 6,124.5 | 6,762.4 |
| Depreciation, % | 1.97 | 1.68 | 1.67 | 1.7 | 1.64 | 1.73 | 1.73 | 1.73 | 1.73 | 1.73 |
| EBIT | 7,128.0 | 11,675.0 | 13,276.0 | 13,686.0 | 21,260.0 | 16,784.7 | 18,532.8 | 20,463.1 | 22,594.3 | 24,947.6 |
| EBIT, % | 4.41 | 5.86 | 6.35 | 6.4 | 8.94 | 6.39 | 6.39 | 6.39 | 6.39 | 6.39 |
| Total Cash | 4,165.0 | 3,357.0 | 4,037.0 | 7,336.0 | 19,449.0 | 9,348.7 | 10,322.4 | 11,397.5 | 12,584.5 | 13,895.2 |
| Total Cash, percent | .0 | .0 | .0 | .0 | .0 | .0 | .0 | .0 | .0 | .0 |
| Account Receivables | 43,846.0 | 52,731.0 | 52,685.0 | 50,226.0 | 54,217.0 | 65,689.0 | 72,530.6 | 80,084.8 | 88,425.7 | 97,635.4 |
| Account Receivables, % | 27.12 | 26.47 | 25.19 | 23.48 | 22.79 | 25.01 | 25.01 | 25.01 | 25.01 | 25.01 |
| Inventories | 21,541.0 | 26,046.0 | 28,161.0 | 29,038.0 | 33,024.0 | 35,363.1 | 39,046.2 | 43,112.9 | 47,603.2 | 52,561.2 |
| Inventories, % | 13.32 | 13.08 | 13.47 | 13.58 | 13.88 | 13.46 | 13.46 | 13.46 | 13.46 | 13.46 |
| Accounts Payable | 22,368.0 | 26,674.0 | 24,858.0 | 25,994.0 | 28,094.0 | 33,131.5 | 36,582.2 | 40,392.3 | 44,599.2 | 49,244.3 |
| Accounts Payable, % | 13.83 | 13.39 | 11.89 | 12.15 | 11.81 | 12.61 | 12.61 | 12.61 | 12.61 | 12.61 |
| Capital Expenditure | -3,516.0 | -4,867.0 | -4,930.0 | -4,051.0 | -6,956.0 | -6,194.8 | -6,840.0 | -7,552.5 | -8,339.1 | -9,207.6 |
| Capital Expenditure, % | -2.17 | -2.44 | -2.36 | -1.89 | -2.92 | -2.36 | -2.36 | -2.36 | -2.36 | -2.36 |
| Tax Rate, % | 45.04 | 45.04 | 45.04 | 45.04 | 45.04 | 45.04 | 45.04 | 45.04 | 45.04 | 45.04 |
| EBITAT | 5,259.7 | 9,653.1 | 9,793.6 | 9,230.5 | 11,684.6 | 11,838.1 | 13,071.1 | 14,432.4 | 15,935.6 | 17,595.3 |
| Depreciation | ||||||||||
| Changes in Account Receivables | ||||||||||
| Changes in Inventories | ||||||||||
| Changes in Accounts Payable | ||||||||||
| Capital Expenditure | ||||||||||
| UFCF | -38,092.3 | -952.9 | 4,475.6 | 11,535.5 | 2,754.6 | 1,419.4 | 4,180.6 | 4,616.0 | 5,096.8 | 5,627.6 |
| WACC, % | 6.47 | 6.53 | 6.47 | 6.42 | 6.33 | 6.45 | 6.45 | 6.45 | 6.45 | 6.45 |
| PV UFCF | ||||||||||
| SUM PV UFCF | 16,938.0 | |||||||||
| Long Term Growth Rate, % | 0.50 | |||||||||
| Free cash flow (T + 1) | 5,656 | |||||||||
| Terminal Value | 95,119 | |||||||||
| Present Terminal Value | 69,602 | |||||||||
| Enterprise Value | 86,540 | |||||||||
| Net Debt | 34,715 | |||||||||
| Equity Value | 51,825 | |||||||||
| Diluted Shares Outstanding, MM | 30 | |||||||||
| Equity Value Per Share | 1,753.33 |
What You Will Receive
- Authentic SWCC Data: Preloaded financials – including revenue and EBIT – based on real and forecasted figures for SWCC Showa Holdings Co., Ltd. (5805T).
- Comprehensive Customization: Modify all essential parameters (highlighted cells) such as WACC, growth %, and tax rates to suit your analysis.
- Immediate Valuation Updates: Automatic recalculations that allow you to assess the effect of changes on the fair value of SWCC Showa Holdings Co., Ltd. (5805T).
- Flexible Excel Template: Designed for quick adjustments, scenario analysis, and in-depth projections.
- Efficient and Precise: Avoid the hassle of creating models from scratch while ensuring accuracy and adaptability.
Core Highlights
- Authentic SWCC Financial Data: Gain access to precise, pre-loaded historical performance and future forecasts for Showa Holdings Co., Ltd. (5805T).
- Adjustable Projection Parameters: Modify the yellow-highlighted fields including WACC, growth rates, and profit margins as per your analysis.
- Real-Time Calculations: Automatic updates for DCF, Net Present Value (NPV), and cash flow evaluations.
- Visual Insights Dashboard: User-friendly charts and summaries to clearly present your valuation findings.
- Designed for All Skill Levels: An intuitive layout tailored for investors, CFOs, and consultants alike.
How It Works
- Step 1: Download the Excel file.
- Step 2: Examine the pre-filled SWCC Showa Holdings Co., Ltd. (5805T) data, including historical and projected figures.
- Step 3: Modify key assumptions (highlighted in yellow) according to your analysis.
- Step 4: Observe automatic recalculations for SWCC Showa Holdings Co., Ltd.'s intrinsic value.
- Step 5: Utilize the results for investment decisions or reporting purposes.
Why Choose the SWCC Showa Holdings Calculator?
- Precision: Utilizes authentic financial data from SWCC Showa Holdings for reliable results.
- Adaptability: Crafted for users to easily adjust and test various inputs.
- Efficiency: Avoid the complexities of creating a DCF model from the ground up.
- Expert-Level Quality: Built with the accuracy and functionality expected at the CFO level.
- Intuitive Interface: Simple to navigate, even for those new to financial modeling.
Who Should Use This Product?
- Individual Investors: Make informed decisions about buying or selling SWCC Showa Holdings Co., Ltd. (5805T) shares.
- Financial Analysts: Enhance valuation processes with ready-to-use financial models for SWCC Showa Holdings Co., Ltd. (5805T).
- Consultants: Provide clients with accurate and timely valuation insights related to SWCC Showa Holdings Co., Ltd. (5805T).
- Business Owners: Gain insights into how large companies like SWCC Showa Holdings Co., Ltd. (5805T) are valued to inform your strategic decisions.
- Finance Students: Learn valuation methodologies using real-world data from SWCC Showa Holdings Co., Ltd. (5805T) and similar companies.
Contents of the Template
- Operating and Balance Sheet Data: Pre-filled historical data and forecasts for SWCC Showa Holdings Co., Ltd. (5805T), including revenue, EBITDA, EBIT, and capital expenditures.
- WACC Calculation: A dedicated sheet for calculating the Weighted Average Cost of Capital (WACC), featuring parameters such as Beta, risk-free rate, and share price.
- DCF Valuation (Unlevered and Levered): Customizable Discounted Cash Flow models that display intrinsic value along with comprehensive calculations.
- Financial Statements: Pre-loaded annual and quarterly financial statements for SWCC Showa Holdings Co., Ltd. (5805T) to facilitate analysis.
- Key Ratios: A selection of ratios covering profitability, leverage, and efficiency specific to SWCC Showa Holdings Co., Ltd. (5805T).
- Dashboard and Charts: A visual overview of valuation outputs and assumptions to simplify the analysis of results.
Disclaimer
All information, articles, and product details provided on this website are for general informational and educational purposes only. We do not claim any ownership over, nor do we intend to infringe upon, any trademarks, copyrights, logos, brand names, or other intellectual property mentioned or depicted on this site. Such intellectual property remains the property of its respective owners, and any references here are made solely for identification or informational purposes, without implying any affiliation, endorsement, or partnership.
We make no representations or warranties, express or implied, regarding the accuracy, completeness, or suitability of any content or products presented. Nothing on this website should be construed as legal, tax, investment, financial, medical, or other professional advice. In addition, no part of this site—including articles or product references—constitutes a solicitation, recommendation, endorsement, advertisement, or offer to buy or sell any securities, franchises, or other financial instruments, particularly in jurisdictions where such activity would be unlawful.
All content is of a general nature and may not address the specific circumstances of any individual or entity. It is not a substitute for professional advice or services. Any actions you take based on the information provided here are strictly at your own risk. You accept full responsibility for any decisions or outcomes arising from your use of this website and agree to release us from any liability in connection with your use of, or reliance upon, the content or products found herein.