
|
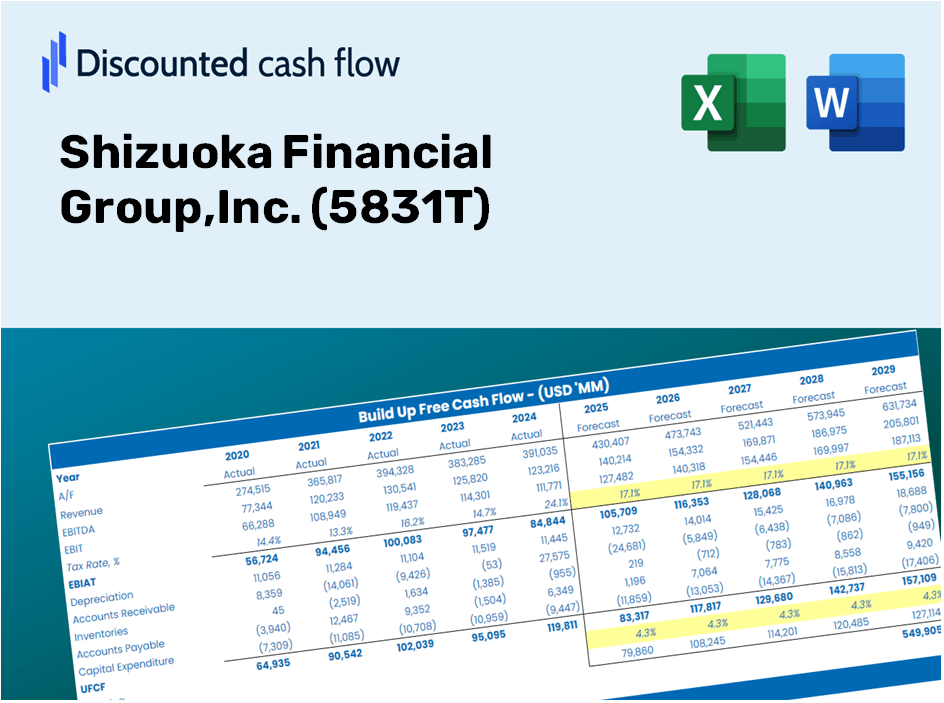
Shizuoka Financial Group, inc. (5831.T) Évaluation DCF |
Entièrement Modifiable: Adapté À Vos Besoins Dans Excel Ou Sheets
Conception Professionnelle: Modèles Fiables Et Conformes Aux Normes Du Secteur
Pré-Construits Pour Une Utilisation Rapide Et Efficace
Compatible MAC/PC, entièrement débloqué
Aucune Expertise N'Est Requise; Facile À Suivre
Shizuoka Financial Group,Inc. (5831.T) Bundle
Rationalisez votre analyse et améliorez la précision avec notre (5831T) Calculator DCF! Équipée des données réelles de Shizuoka Financial Group, Inc. et des hypothèses personnalisables, cet outil vous permet de prévoir, analyser et valoriser le groupe financier Shizuoka comme un investisseur chevronné.
Discounted Cash Flow (DCF) - (USD MM)
| Year | AY1 2020 |
AY2 2021 |
AY3 2022 |
AY4 2023 |
AY5 2024 |
FY1 2025 |
FY2 2026 |
FY3 2027 |
FY4 2028 |
FY5 2029 |
|---|---|---|---|---|---|---|---|---|---|---|
| Revenue | 218,569.0 | 233,085.0 | 247,787.0 | 308,126.0 | 262,832.0 | 277,682.2 | 293,371.4 | 309,947.1 | 327,459.3 | 345,961.0 |
| Revenue Growth, % | 0 | 6.64 | 6.31 | 24.35 | -14.7 | 5.65 | 5.65 | 5.65 | 5.65 | 5.65 |
| EBITDA | 74,102.0 | 78,261.0 | 91,285.0 | 94,719.0 | 117,827.0 | 99,904.3 | 105,549.0 | 111,512.6 | 117,813.1 | 124,469.6 |
| EBITDA, % | 33.9 | 33.58 | 36.84 | 30.74 | 44.83 | 35.98 | 35.98 | 35.98 | 35.98 | 35.98 |
| Depreciation | 13,411.0 | 19,460.0 | 17,965.0 | 15,229.0 | 13,197.0 | 17,604.2 | 18,598.8 | 19,649.7 | 20,759.9 | 21,932.8 |
| Depreciation, % | 6.14 | 8.35 | 7.25 | 4.94 | 5.02 | 6.34 | 6.34 | 6.34 | 6.34 | 6.34 |
| EBIT | 60,691.0 | 58,801.0 | 73,320.0 | 79,490.0 | 104,630.0 | 82,300.1 | 86,950.1 | 91,862.9 | 97,053.2 | 102,536.8 |
| EBIT, % | 27.77 | 25.23 | 29.59 | 25.8 | 39.81 | 29.64 | 29.64 | 29.64 | 29.64 | 29.64 |
| Total Cash | -2,021,439.0 | 2,275,851.0 | 1,747,165.0 | 1,562,796.0 | 993,913.0 | 166,609.3 | 176,022.9 | 185,968.3 | 196,475.6 | 207,576.6 |
| Total Cash, percent | .0 | .0 | .0 | .0 | .0 | .0 | .0 | .0 | .0 | .0 |
| Account Receivables | .0 | .0 | .0 | .0 | .0 | .0 | .0 | .0 | .0 | .0 |
| Account Receivables, % | 0 | 0 | 0 | 0 | 0 | 0 | 0 | 0 | 0 | 0 |
| Inventories | .0 | .0 | .0 | .0 | .0 | .0 | .0 | .0 | .0 | .0 |
| Inventories, % | 0 | 0 | 0 | 0 | 0 | 0 | 0 | 0 | 0 | 0 |
| Accounts Payable | .0 | .0 | .0 | .0 | .0 | .0 | .0 | .0 | .0 | .0 |
| Accounts Payable, % | 0 | 0 | 0 | 0 | 0 | 0 | 0 | 0 | 0 | 0 |
| Capital Expenditure | -16,852.0 | -14,040.0 | -12,765.0 | -12,077.0 | -5,518.0 | -13,830.9 | -14,612.4 | -15,438.0 | -16,310.3 | -17,231.8 |
| Capital Expenditure, % | -7.71 | -6.02 | -5.15 | -3.92 | -2.1 | -4.98 | -4.98 | -4.98 | -4.98 | -4.98 |
| Tax Rate, % | 28.68 | 28.68 | 28.68 | 28.68 | 28.68 | 28.68 | 28.68 | 28.68 | 28.68 | 28.68 |
| EBITAT | 43,639.0 | 41,635.0 | 52,397.0 | 57,760.0 | 74,617.0 | 58,951.9 | 62,282.7 | 65,801.7 | 69,519.6 | 73,447.5 |
| Depreciation | ||||||||||
| Changes in Account Receivables | ||||||||||
| Changes in Inventories | ||||||||||
| Changes in Accounts Payable | ||||||||||
| Capital Expenditure | ||||||||||
| UFCF | 40,198.0 | 47,055.0 | 57,597.0 | 60,912.0 | 82,296.0 | 62,725.2 | 66,269.2 | 70,013.4 | 73,969.2 | 78,148.5 |
| WACC, % | 3.53 | 3.5 | 3.52 | 3.55 | 3.52 | 3.52 | 3.52 | 3.52 | 3.52 | 3.52 |
| PV UFCF | ||||||||||
| SUM PV UFCF | 315,648.9 | |||||||||
| Long Term Growth Rate, % | 2.00 | |||||||||
| Free cash flow (T + 1) | 79,712 | |||||||||
| Terminal Value | 5,229,508 | |||||||||
| Present Terminal Value | 4,397,948 | |||||||||
| Enterprise Value | 4,713,597 | |||||||||
| Net Debt | 757,360 | |||||||||
| Equity Value | 3,956,237 | |||||||||
| Diluted Shares Outstanding, MM | 547 | |||||||||
| Equity Value Per Share | 7,229.20 |
What You Will Receive
- Authentic 5831T Financial Data: Pre-loaded with Shizuoka Financial Group's historical and projected figures for accurate analysis.
- Fully Customizable Template: Easily adjust essential inputs such as revenue growth, WACC, and EBITDA percentage.
- Instant Calculations: Witness the intrinsic value of Shizuoka Financial Group update in real-time as you make changes.
- Professional Valuation Tool: Tailored for investors, analysts, and consultants aiming for precise DCF outcomes.
- User-Friendly Interface: Straightforward layout and clear guidance suitable for users of all experience levels.
Key Features
- Real-Time SFH Data: Pre-filled with Shizuoka Financial Group, Inc.'s historical financial performance and future projections.
- Completely Customizable Inputs: Modify revenue growth rates, profit margins, WACC, tax assumptions, and capital spending.
- Adaptive Valuation Model: Automatically recalculates Net Present Value (NPV) and intrinsic value based on user inputs.
- Scenario Analysis: Develop various forecasting scenarios to explore different valuation possibilities.
- Intuitive Interface: Easy-to-navigate and designed for both experienced professionals and newcomers.
How It Works
- Step 1: Download the Excel file for Shizuoka Financial Group, Inc. (5831T).
- Step 2: Examine the pre-filled financial data and projections for Shizuoka Financial Group, Inc. (5831T).
- Step 3: Adjust key inputs such as revenue growth, WACC, and tax rates (highlighted cells).
- Step 4: Observe the DCF model refreshing in real-time as you modify the assumptions.
- Step 5: Evaluate the results and utilize the findings for your investment strategies.
Why Choose the Shizuoka Financial Group Calculator?
- Precision: Utilizes authentic Shizuoka Financial Group (5831T) data for reliable results.
- Versatility: Allows users to easily adjust and experiment with various inputs.
- Efficiency: Eliminate the need to create a DCF model from the ground up.
- Expert-Level: Crafted with the accuracy and functionality expected by financial executives.
- Accessible: Intuitive design ensures usability for individuals at all experience levels in financial modeling.
Who Can Benefit from This Product?
- Finance Students: Master valuation techniques and apply them to real-world data.
- Researchers: Integrate industry-standard models into your academic studies or research projects.
- Investors: Validate your investment strategies and assess valuation results for Shizuoka Financial Group, Inc. (5831T).
- Financial Analysts: Enhance your efficiency with a customizable DCF model that’s ready to use.
- Entrepreneurs: Understand the analytical approaches used for evaluating large public companies like Shizuoka Financial Group, Inc. (5831T).
Contents of the Template
- Comprehensive DCF Model: Editable template featuring in-depth valuation calculations.
- Real-World Data: Shizuoka Financial Group, Inc. (5831T)’s historical and projected financials preloaded for thorough analysis.
- Customizable Parameters: Modify WACC, growth rates, and tax assumptions to explore different scenarios.
- Financial Statements: Complete annual and quarterly breakdowns for enhanced insights.
- Key Ratios: Integrated analysis for evaluating profitability, efficiency, and leverage.
- Dashboard with Visual Outputs: Charts and tables designed for clear and actionable results.
Disclaimer
All information, articles, and product details provided on this website are for general informational and educational purposes only. We do not claim any ownership over, nor do we intend to infringe upon, any trademarks, copyrights, logos, brand names, or other intellectual property mentioned or depicted on this site. Such intellectual property remains the property of its respective owners, and any references here are made solely for identification or informational purposes, without implying any affiliation, endorsement, or partnership.
We make no representations or warranties, express or implied, regarding the accuracy, completeness, or suitability of any content or products presented. Nothing on this website should be construed as legal, tax, investment, financial, medical, or other professional advice. In addition, no part of this site—including articles or product references—constitutes a solicitation, recommendation, endorsement, advertisement, or offer to buy or sell any securities, franchises, or other financial instruments, particularly in jurisdictions where such activity would be unlawful.
All content is of a general nature and may not address the specific circumstances of any individual or entity. It is not a substitute for professional advice or services. Any actions you take based on the information provided here are strictly at your own risk. You accept full responsibility for any decisions or outcomes arising from your use of this website and agree to release us from any liability in connection with your use of, or reliance upon, the content or products found herein.