
|
Chugin Financial Group, Inc. (5832.t) Évaluation DCF |
Entièrement Modifiable: Adapté À Vos Besoins Dans Excel Ou Sheets
Conception Professionnelle: Modèles Fiables Et Conformes Aux Normes Du Secteur
Pré-Construits Pour Une Utilisation Rapide Et Efficace
Compatible MAC/PC, entièrement débloqué
Aucune Expertise N'Est Requise; Facile À Suivre
Chugin Financial Group,Inc. (5832.T) Bundle
Gagnez du temps et améliorez la précision avec notre (5832T) Calculator DCF! En utilisant de vraies données de Chugin Financial Group, Inc. et en permettant des hypothèses personnalisables, cet outil vous permet de prévoir, analyser et évaluer (5832T) comme un investisseur chevronné.
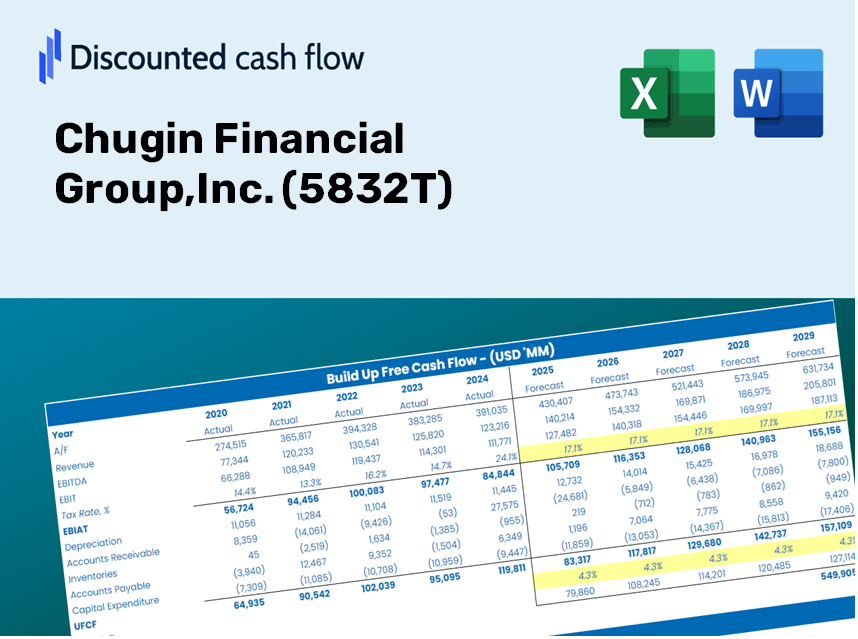
Discounted Cash Flow (DCF) - (USD MM)
| Year | AY1 2020 |
AY2 2021 |
AY3 2022 |
AY4 2023 |
AY5 2024 |
FY1 2025 |
FY2 2026 |
FY3 2027 |
FY4 2028 |
FY5 2029 |
|---|---|---|---|---|---|---|---|---|---|---|
| Revenue | 107,328.0 | 116,868.0 | 157,416.0 | 113,708.0 | 123,093.0 | 130,500.7 | 138,354.2 | 146,680.3 | 155,507.5 | 164,865.9 |
| Revenue Growth, % | 0 | 8.89 | 34.7 | -27.77 | 8.25 | 6.02 | 6.02 | 6.02 | 6.02 | 6.02 |
| EBITDA | 25,385.0 | 29,869.0 | 32,697.0 | 24,978.0 | 31,665.0 | 30,712.6 | 32,560.8 | 34,520.3 | 36,597.8 | 38,800.2 |
| EBITDA, % | 23.65 | 25.56 | 20.77 | 21.97 | 25.72 | 23.53 | 23.53 | 23.53 | 23.53 | 23.53 |
| Depreciation | 4,474.0 | 4,460.0 | 3,177.0 | 3,312.0 | .0 | 3,371.0 | 3,573.9 | 3,789.0 | 4,017.0 | 4,258.7 |
| Depreciation, % | 4.17 | 3.82 | 2.02 | 2.91 | 0 | 2.58 | 2.58 | 2.58 | 2.58 | 2.58 |
| EBIT | 20,911.0 | 25,409.0 | 29,520.0 | 21,666.0 | 31,665.0 | 27,341.5 | 28,986.9 | 30,731.4 | 32,580.8 | 34,541.5 |
| EBIT, % | 19.48 | 21.74 | 18.75 | 19.05 | 25.72 | 20.95 | 20.95 | 20.95 | 20.95 | 20.95 |
| Total Cash | -1,026,113.0 | 1,757,165.0 | 1,510,394.0 | 1,418,224.0 | .0 | 52,200.3 | 55,341.7 | 58,672.1 | 62,203.0 | 65,946.3 |
| Total Cash, percent | .0 | .0 | .0 | .0 | .0 | .0 | .0 | .0 | .0 | .0 |
| Account Receivables | .0 | .0 | .0 | .0 | .0 | .0 | .0 | .0 | .0 | .0 |
| Account Receivables, % | 0 | 0 | 0 | 0 | 0 | 0 | 0 | 0 | 0 | 0 |
| Inventories | .0 | .0 | .0 | .0 | .0 | .0 | .0 | .0 | .0 | .0 |
| Inventories, % | 0 | 0 | 0 | 0 | 0 | 0 | 0 | 0 | 0 | 0 |
| Accounts Payable | .0 | .0 | .0 | .0 | .0 | .0 | .0 | .0 | .0 | .0 |
| Accounts Payable, % | 0 | 0 | 0 | 0 | 0 | 0 | 0 | 0 | 0 | 0 |
| Capital Expenditure | -2,605.0 | -2,622.0 | -2,143.0 | -3,500.0 | -11,006.0 | -4,711.4 | -4,995.0 | -5,295.5 | -5,614.2 | -5,952.1 |
| Capital Expenditure, % | -2.43 | -2.24 | -1.36 | -3.08 | -8.94 | -3.61 | -3.61 | -3.61 | -3.61 | -3.61 |
| Tax Rate, % | 28.34 | 28.34 | 28.34 | 28.34 | 28.34 | 28.34 | 28.34 | 28.34 | 28.34 | 28.34 |
| EBITAT | 14,418.7 | 18,374.0 | 20,487.4 | 14,997.7 | 22,692.1 | 19,224.0 | 20,380.9 | 21,607.4 | 22,907.7 | 24,286.3 |
| Depreciation | ||||||||||
| Changes in Account Receivables | ||||||||||
| Changes in Inventories | ||||||||||
| Changes in Accounts Payable | ||||||||||
| Capital Expenditure | ||||||||||
| UFCF | 16,287.7 | 20,212.0 | 21,521.4 | 14,809.7 | 11,686.1 | 17,883.6 | 18,959.8 | 20,100.8 | 21,310.5 | 22,592.9 |
| WACC, % | 2.91 | 3.02 | 2.93 | 2.92 | 3 | 2.96 | 2.96 | 2.96 | 2.96 | 2.96 |
| PV UFCF | ||||||||||
| SUM PV UFCF | 92,170.8 | |||||||||
| Long Term Growth Rate, % | 2.00 | |||||||||
| Free cash flow (T + 1) | 23,045 | |||||||||
| Terminal Value | 2,409,018 | |||||||||
| Present Terminal Value | 2,082,423 | |||||||||
| Enterprise Value | 2,174,594 | |||||||||
| Net Debt | 368,014 | |||||||||
| Equity Value | 1,806,580 | |||||||||
| Diluted Shares Outstanding, MM | 180 | |||||||||
| Equity Value Per Share | 10,040.07 |
Benefits You'll Receive
- Comprehensive Financial Model: Utilize Chugin Financial Group, Inc.'s (5832T) actual data for accurate DCF valuation.
- Complete Forecasting Control: Modify revenue growth, margins, WACC, and other essential metrics as needed.
- Real-Time Calculations: Automatic updates provide instant insights as you make adjustments.
- Professional-Grade Template: An expertly crafted Excel file ready for investor presentations.
- Flexible and Reusable: Designed for adaptability, allowing for repeated use in detailed forecasting.
Core Capabilities
- Comprehensive DCF Model: Features both unlevered and levered DCF valuation frameworks.
- WACC Calculator: User-friendly Weighted Average Cost of Capital tool with adjustable parameters.
- Customizable Forecast Assumptions: Alter projections for growth rates, capital investments, and discount factors.
- Integrated Financial Ratios: Evaluate profitability, leverage, and operational efficiency metrics for Chugin Financial Group, Inc. (5832T).
- Visual Dashboard and Charts: Graphical representations encapsulate vital valuation metrics for streamlined analysis.
How It Works
- Step 1: Download the prebuilt Excel template featuring Chugin Financial Group, Inc. (5832T) data.
- Step 2: Navigate through the pre-filled sheets to grasp the essential metrics.
- Step 3: Modify forecasts and assumptions within the editable yellow cells (WACC, growth, margins).
- Step 4: Instantly view the recalculated results, including the intrinsic value of Chugin Financial Group, Inc. (5832T).
- Step 5: Make well-informed investment decisions or create reports based on the outputs.
Why Choose Chugin Financial Group, Inc. ([5832T]) Calculator?
- Precision: Leverage genuine Chugin financial data for reliable results.
- Versatility: Allows users to easily explore and adjust input parameters.
- Efficiency: Eliminate the complexities of creating a DCF model from the ground up.
- Expert-Level: Crafted with the expertise and functionality expected by CFOs.
- Intuitive: Accessibly designed for users, regardless of their financial modeling background.
Who Can Benefit from Chugin Financial Group, Inc. (5832T)?
- Individual Investors: Gain valuable insights for making informed buying or selling decisions regarding Chugin stock.
- Financial Analysts: Enhance valuation efficiency with comprehensive financial models tailored for Chugin Financial Group, Inc. (5832T).
- Consultants: Provide accurate and timely valuation assessments to clients based on Chugin's market performance.
- Business Owners: Learn how large entities like Chugin Financial Group, Inc. (5832T) are valued to inform your own business strategies.
- Finance Students: Acquire practical valuation skills using real-time data and case studies from Chugin Financial Group, Inc. (5832T).
Contents of the Template
- Comprehensive DCF Model: Fully editable template featuring in-depth valuation calculations.
- Real-World Data: Chugin Financial Group, Inc. (5832T)’s historical and projected financial data preloaded for evaluation.
- Customizable Parameters: Modify WACC, growth rates, and tax assumptions to explore different scenarios.
- Financial Statements: Complete annual and quarterly breakdowns for a more thorough understanding.
- Key Ratios: Integrated analysis for profitability, efficiency, and leverage metrics.
- Dashboard with Visual Outputs: Graphs and tables providing clear and actionable insights.
Disclaimer
All information, articles, and product details provided on this website are for general informational and educational purposes only. We do not claim any ownership over, nor do we intend to infringe upon, any trademarks, copyrights, logos, brand names, or other intellectual property mentioned or depicted on this site. Such intellectual property remains the property of its respective owners, and any references here are made solely for identification or informational purposes, without implying any affiliation, endorsement, or partnership.
We make no representations or warranties, express or implied, regarding the accuracy, completeness, or suitability of any content or products presented. Nothing on this website should be construed as legal, tax, investment, financial, medical, or other professional advice. In addition, no part of this site—including articles or product references—constitutes a solicitation, recommendation, endorsement, advertisement, or offer to buy or sell any securities, franchises, or other financial instruments, particularly in jurisdictions where such activity would be unlawful.
All content is of a general nature and may not address the specific circumstances of any individual or entity. It is not a substitute for professional advice or services. Any actions you take based on the information provided here are strictly at your own risk. You accept full responsibility for any decisions or outcomes arising from your use of this website and agree to release us from any liability in connection with your use of, or reliance upon, the content or products found herein.