
|
Toyo Seikan Group Holdings, Ltd. (5901.T) Évaluation DCF |
Entièrement Modifiable: Adapté À Vos Besoins Dans Excel Ou Sheets
Conception Professionnelle: Modèles Fiables Et Conformes Aux Normes Du Secteur
Pré-Construits Pour Une Utilisation Rapide Et Efficace
Compatible MAC/PC, entièrement débloqué
Aucune Expertise N'Est Requise; Facile À Suivre
Toyo Seikan Group Holdings, Ltd. (5901.T) Bundle
Explorez Toyo Seikan Group Holdings, Ltd. (5901T) Prospects financiers avec notre calculatrice DCF conviviale! Entrez vos projections pour la croissance, les marges et les dépenses pour déterminer la valeur intrinsèque de Toyo Seikan Group Holdings, Ltd. (5901T) et orientez votre approche d'investissement.
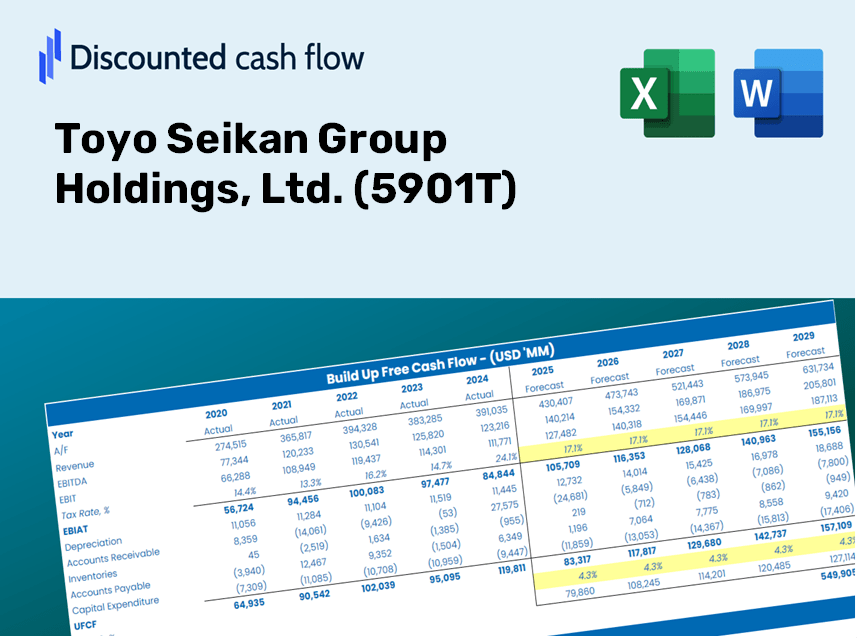
Discounted Cash Flow (DCF) - (USD MM)
| Year | AY1 2020 |
AY2 2021 |
AY3 2022 |
AY4 2023 |
AY5 2024 |
FY1 2025 |
FY2 2026 |
FY3 2027 |
FY4 2028 |
FY5 2029 |
|---|---|---|---|---|---|---|---|---|---|---|
| Revenue | 748,724.0 | 821,565.0 | 906,025.0 | 950,663.0 | 922,516.0 | 973,196.9 | 1,026,662.1 | 1,083,064.6 | 1,142,565.7 | 1,205,335.6 |
| Revenue Growth, % | 0 | 9.73 | 10.28 | 4.93 | -2.96 | 5.49 | 5.49 | 5.49 | 5.49 | 5.49 |
| EBITDA | 72,098.0 | 112,188.0 | 60,332.0 | 93,257.0 | 92,735.0 | 96,941.9 | 102,267.7 | 107,886.0 | 113,813.0 | 120,065.7 |
| EBITDA, % | 9.63 | 13.66 | 6.66 | 9.81 | 10.05 | 9.96 | 9.96 | 9.96 | 9.96 | 9.96 |
| Depreciation | 47,141.0 | 51,312.0 | 52,935.0 | 55,402.0 | 56,057.0 | 58,953.6 | 62,192.4 | 65,609.1 | 69,213.5 | 73,015.9 |
| Depreciation, % | 6.3 | 6.25 | 5.84 | 5.83 | 6.08 | 6.06 | 6.06 | 6.06 | 6.06 | 6.06 |
| EBIT | 24,957.0 | 60,876.0 | 7,397.0 | 37,855.0 | 36,678.0 | 37,988.3 | 40,075.3 | 42,276.9 | 44,599.5 | 47,049.7 |
| EBIT, % | 3.33 | 7.41 | 0.81642 | 3.98 | 3.98 | 3.9 | 3.9 | 3.9 | 3.9 | 3.9 |
| Total Cash | 117,490.0 | 126,449.0 | 99,704.0 | 90,019.0 | 119,839.0 | 125,634.6 | 132,536.6 | 139,817.9 | 147,499.2 | 155,602.4 |
| Total Cash, percent | .0 | .0 | .0 | .0 | .0 | .0 | .0 | .0 | .0 | .0 |
| Account Receivables | 215,472.0 | 225,529.0 | 257,552.0 | 273,003.0 | 248,708.0 | 273,143.6 | 288,149.5 | 303,979.8 | 320,679.7 | 338,297.1 |
| Account Receivables, % | 28.78 | 27.45 | 28.43 | 28.72 | 26.96 | 28.07 | 28.07 | 28.07 | 28.07 | 28.07 |
| Inventories | 124,497.0 | 158,552.0 | 198,307.0 | 189,862.0 | 199,643.0 | 193,524.0 | 204,155.7 | 215,371.6 | 227,203.6 | 239,685.6 |
| Inventories, % | 16.63 | 19.3 | 21.89 | 19.97 | 21.64 | 19.89 | 19.89 | 19.89 | 19.89 | 19.89 |
| Accounts Payable | 84,345.0 | 104,091.0 | 120,243.0 | 115,955.0 | 109,973.0 | 119,362.1 | 125,919.6 | 132,837.4 | 140,135.1 | 147,833.8 |
| Accounts Payable, % | 11.27 | 12.67 | 13.27 | 12.2 | 11.92 | 12.26 | 12.26 | 12.26 | 12.26 | 12.26 |
| Capital Expenditure | -65,260.0 | -48,652.0 | -63,977.0 | -53,835.0 | -33,621.0 | -60,351.2 | -63,666.8 | -67,164.5 | -70,854.4 | -74,746.9 |
| Capital Expenditure, % | -8.72 | -5.92 | -7.06 | -5.66 | -3.64 | -6.2 | -6.2 | -6.2 | -6.2 | -6.2 |
| Tax Rate, % | 30.91 | 30.91 | 30.91 | 30.91 | 30.91 | 30.91 | 30.91 | 30.91 | 30.91 | 30.91 |
| EBITAT | 16,346.2 | 45,001.6 | 5,566.8 | 25,445.7 | 25,339.5 | 26,666.6 | 28,131.6 | 29,677.0 | 31,307.4 | 33,027.4 |
| Depreciation | ||||||||||
| Changes in Account Receivables | ||||||||||
| Changes in Inventories | ||||||||||
| Changes in Accounts Payable | ||||||||||
| Capital Expenditure | ||||||||||
| UFCF | -257,396.8 | 23,295.6 | -61,101.2 | 15,718.7 | 56,307.5 | 16,341.5 | 7,577.0 | 7,993.2 | 8,432.4 | 8,895.6 |
| WACC, % | 4.03 | 4.12 | 4.13 | 4.05 | 4.07 | 4.08 | 4.08 | 4.08 | 4.08 | 4.08 |
| PV UFCF | ||||||||||
| SUM PV UFCF | 44,257.3 | |||||||||
| Long Term Growth Rate, % | 3.30 | |||||||||
| Free cash flow (T + 1) | 9,189 | |||||||||
| Terminal Value | 1,181,964 | |||||||||
| Present Terminal Value | 967,879 | |||||||||
| Enterprise Value | 1,012,136 | |||||||||
| Net Debt | 106,453 | |||||||||
| Equity Value | 905,683 | |||||||||
| Diluted Shares Outstanding, MM | 167 | |||||||||
| Equity Value Per Share | 5,421.24 |
What You Will Receive
- Authentic 5901T Financial Data: Automatically populated with Toyo Seikan's historical and forecasted data for accurate analysis.
- Completely Customizable Template: Easily adjust key metrics such as revenue growth, WACC, and EBITDA percentage.
- Instant Calculations: Watch Toyo Seikan's intrinsic value refresh in real-time as you make modifications.
- Advanced Valuation Tool: Tailored for investors, analysts, and consultants seeking reliable DCF results.
- Intuitive User Interface: Designed with a straightforward layout and clear guidance suitable for all skill levels.
Key Features
- Authentic Financial Data for Toyo Seikan: Gain access to precise, pre-loaded historical data and forecasts for future performance.
- Adjustable Forecast Parameters: Modify the highlighted cells, such as WACC, growth rates, and profit margins.
- Real-Time Calculations: Enjoy automatic updates for DCF, Net Present Value (NPV), and cash flow assessments.
- User-Friendly Dashboard: Clear and informative charts and summaries to help visualize your valuation outcomes.
- Designed for All Skill Levels: An intuitive framework tailored for investors, CFOs, and consultants alike.
How It Works
- Step 1: Download the Excel file.
- Step 2: Review pre-filled data for Toyo Seikan Group Holdings, Ltd. (5901T) including historical performance and forecasts.
- Step 3: Modify key assumptions (highlighted in yellow) based on your insights.
- Step 4: Observe automatic recalculations reflecting the intrinsic value of Toyo Seikan Group Holdings, Ltd. (5901T).
- Step 5: Utilize the results for your investment strategies or reporting purposes.
Why Choose This Calculator for Toyo Seikan Group Holdings, Ltd. (5901T)?
- Precise Financial Data: Utilize accurate Toyo Seikan financials for dependable valuation outcomes.
- Fully Customizable: Tailor essential inputs such as growth rates, WACC, and tax rates to align with your forecasts.
- Efficient: Built-in calculations save you from starting from scratch.
- Expert-Level Tool: Perfectly crafted for investors, analysts, and consultants in the industry.
- Easy to Navigate: User-friendly design and clear, step-by-step guidance make it accessible for everyone.
Who Should Use This Product?
- Investors: Determine the fair value of Toyo Seikan Group Holdings, Ltd. (5901T) to inform your investment choices.
- CFOs: Utilize a professional-grade DCF model for comprehensive financial reporting and analysis.
- Consultants: Easily customize the template for client valuation reports.
- Entrepreneurs: Acquire insights into financial modeling techniques employed by leading corporations.
- Educators: Employ this resource as a teaching tool to illustrate various valuation methodologies.
Contents of the Template
- Operating and Balance Sheet Data: Pre-filled historical data and forecasts for Toyo Seikan Group Holdings, Ltd. (5901T), including revenue, EBITDA, EBIT, and capital expenditures.
- WACC Calculation: A dedicated sheet for calculating the Weighted Average Cost of Capital (WACC), featuring parameters such as Beta, risk-free rate, and share price.
- DCF Valuation (Unlevered and Levered): Customizable Discounted Cash Flow models that reveal intrinsic value through detailed calculations.
- Financial Statements: Pre-loaded annual and quarterly financial statements to facilitate thorough analysis.
- Key Ratios: Contains profitability, leverage, and efficiency ratios specifically for Toyo Seikan Group Holdings, Ltd. (5901T).
- Dashboard and Charts: Visual representations of valuation outputs and assumptions for easy result analysis.
Disclaimer
All information, articles, and product details provided on this website are for general informational and educational purposes only. We do not claim any ownership over, nor do we intend to infringe upon, any trademarks, copyrights, logos, brand names, or other intellectual property mentioned or depicted on this site. Such intellectual property remains the property of its respective owners, and any references here are made solely for identification or informational purposes, without implying any affiliation, endorsement, or partnership.
We make no representations or warranties, express or implied, regarding the accuracy, completeness, or suitability of any content or products presented. Nothing on this website should be construed as legal, tax, investment, financial, medical, or other professional advice. In addition, no part of this site—including articles or product references—constitutes a solicitation, recommendation, endorsement, advertisement, or offer to buy or sell any securities, franchises, or other financial instruments, particularly in jurisdictions where such activity would be unlawful.
All content is of a general nature and may not address the specific circumstances of any individual or entity. It is not a substitute for professional advice or services. Any actions you take based on the information provided here are strictly at your own risk. You accept full responsibility for any decisions or outcomes arising from your use of this website and agree to release us from any liability in connection with your use of, or reliance upon, the content or products found herein.