
|
Sanwa Holdings Corporation (5929.T) Évaluation DCF |
Entièrement Modifiable: Adapté À Vos Besoins Dans Excel Ou Sheets
Conception Professionnelle: Modèles Fiables Et Conformes Aux Normes Du Secteur
Pré-Construits Pour Une Utilisation Rapide Et Efficace
Compatible MAC/PC, entièrement débloqué
Aucune Expertise N'Est Requise; Facile À Suivre
Sanwa Holdings Corporation (5929.T) Bundle
Améliorez votre stratégie d'investissement avec la calculatrice DCF de Sanwa Holdings Corporation (5929T)! Explorez les finances authentiques de Sanwa, ajustez les projections et dépenses de croissance et observez instantanément comment ces modifications affectent la valeur intrinsèque de Sanwa Holdings Corporation (5929T).
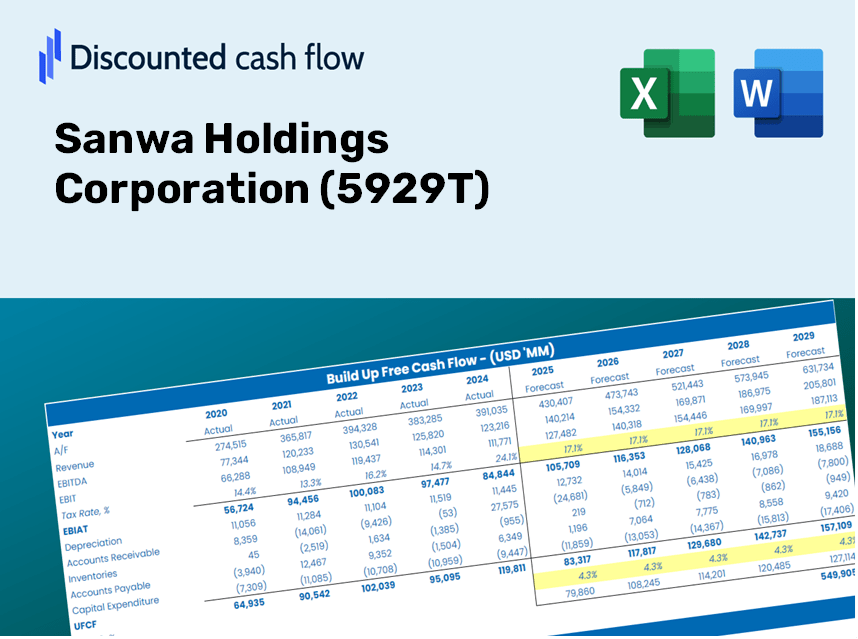
Discounted Cash Flow (DCF) - (USD MM)
| Year | AY1 2021 |
AY2 2022 |
AY3 2023 |
AY4 2024 |
AY5 2025 |
FY1 2026 |
FY2 2027 |
FY3 2028 |
FY4 2029 |
FY5 2030 |
|---|---|---|---|---|---|---|---|---|---|---|
| Revenue | 427,061.0 | 468,956.0 | 588,159.0 | 611,107.0 | 662,380.0 | 741,071.9 | 829,112.6 | 927,612.7 | 1,037,814.8 | 1,161,109.1 |
| Revenue Growth, % | 0 | 9.81 | 25.42 | 3.9 | 8.39 | 11.88 | 11.88 | 11.88 | 11.88 | 11.88 |
| EBITDA | 43,601.0 | 47,106.0 | 64,476.0 | 79,584.0 | 98,787.0 | 87,674.2 | 98,090.0 | 109,743.3 | 122,781.0 | 137,367.6 |
| EBITDA, % | 10.21 | 10.04 | 10.96 | 13.02 | 14.91 | 11.83 | 11.83 | 11.83 | 11.83 | 11.83 |
| Depreciation | 11,574.0 | 12,951.0 | 14,786.0 | 16,076.0 | 16,185.0 | 19,356.6 | 21,656.2 | 24,229.0 | 27,107.4 | 30,327.8 |
| Depreciation, % | 2.71 | 2.76 | 2.51 | 2.63 | 2.44 | 2.61 | 2.61 | 2.61 | 2.61 | 2.61 |
| EBIT | 32,027.0 | 34,155.0 | 49,690.0 | 63,508.0 | 82,602.0 | 68,317.6 | 76,433.8 | 85,514.3 | 95,673.6 | 107,039.8 |
| EBIT, % | 7.5 | 7.28 | 8.45 | 10.39 | 12.47 | 9.22 | 9.22 | 9.22 | 9.22 | 9.22 |
| Total Cash | 89,807.0 | 61,897.0 | 72,253.0 | 107,795.0 | 134,388.0 | 125,153.0 | 140,021.4 | 156,656.2 | 175,267.3 | 196,089.3 |
| Total Cash, percent | .0 | .0 | .0 | .0 | .0 | .0 | .0 | .0 | .0 | .0 |
| Account Receivables | 85,440.0 | 106,781.0 | 124,172.0 | 129,382.0 | 131,261.0 | 155,442.4 | 173,909.3 | 194,570.0 | 217,685.3 | 243,546.7 |
| Account Receivables, % | 20.01 | 22.77 | 21.11 | 21.17 | 19.82 | 20.98 | 20.98 | 20.98 | 20.98 | 20.98 |
| Inventories | 60,755.0 | 63,677.0 | 80,422.0 | 80,690.0 | 84,481.0 | 99,950.4 | 111,824.7 | 125,109.6 | 139,972.9 | 156,601.9 |
| Inventories, % | 14.23 | 13.58 | 13.67 | 13.2 | 12.75 | 13.49 | 13.49 | 13.49 | 13.49 | 13.49 |
| Accounts Payable | 51,986.0 | 62,558.0 | 66,962.0 | 64,298.0 | 61,189.0 | 83,974.0 | 93,950.3 | 105,111.8 | 117,599.2 | 131,570.2 |
| Accounts Payable, % | 12.17 | 13.34 | 11.39 | 10.52 | 9.24 | 11.33 | 11.33 | 11.33 | 11.33 | 11.33 |
| Capital Expenditure | -8,770.0 | -9,281.0 | -10,041.0 | -13,364.0 | -15,656.0 | -15,251.7 | -17,063.6 | -19,090.8 | -21,358.8 | -23,896.3 |
| Capital Expenditure, % | -2.05 | -1.98 | -1.71 | -2.19 | -2.36 | -2.06 | -2.06 | -2.06 | -2.06 | -2.06 |
| Tax Rate, % | 29.28 | 29.28 | 29.28 | 29.28 | 29.28 | 29.28 | 29.28 | 29.28 | 29.28 | 29.28 |
| EBITAT | 21,600.4 | 23,148.3 | 33,498.6 | 44,070.4 | 58,413.2 | 46,830.9 | 52,394.5 | 58,619.0 | 65,583.1 | 73,374.4 |
| Depreciation | ||||||||||
| Changes in Account Receivables | ||||||||||
| Changes in Inventories | ||||||||||
| Changes in Accounts Payable | ||||||||||
| Capital Expenditure | ||||||||||
| UFCF | -69,804.6 | 13,127.3 | 8,511.6 | 38,640.4 | 50,163.2 | 34,070.0 | 36,622.2 | 40,972.9 | 45,840.6 | 51,286.6 |
| WACC, % | 7.27 | 7.27 | 7.27 | 7.28 | 7.28 | 7.27 | 7.27 | 7.27 | 7.27 | 7.27 |
| PV UFCF | ||||||||||
| SUM PV UFCF | 167,491.0 | |||||||||
| Long Term Growth Rate, % | 2.00 | |||||||||
| Free cash flow (T + 1) | 52,312 | |||||||||
| Terminal Value | 991,854 | |||||||||
| Present Terminal Value | 698,186 | |||||||||
| Enterprise Value | 865,677 | |||||||||
| Net Debt | -68,510 | |||||||||
| Equity Value | 934,187 | |||||||||
| Diluted Shares Outstanding, MM | 218 | |||||||||
| Equity Value Per Share | 4,294.70 |
What You Will Receive
- Accurate (5929T) Financial Data: Pre-loaded with Sanwa Holdings Corporation's historical and projected figures for in-depth analysis.
- Customizable Template: Easily adjust key inputs like revenue growth, WACC, and EBITDA percentages.
- Instant Calculations: Watch as the intrinsic value of Sanwa Holdings Corporation updates immediately with your adjustments.
- Professional Valuation Tool: Tailored for investors, analysts, and consultants aiming for precise DCF evaluations.
- Intuitive Design: A straightforward layout and clear guidelines suitable for users of all experience levels.
Key Features
- Comprehensive DCF Calculator: Features detailed unlevered and levered DCF valuation models tailored for Sanwa Holdings Corporation (5929T).
- WACC Calculator: Comes with a pre-configured Weighted Average Cost of Capital sheet that allows for easy customization of inputs.
- Customizable Forecast Assumptions: Modify growth rates, capital expenditures, and discount rates to fit your analysis needs.
- Integrated Financial Ratios: Evaluate profitability, leverage, and efficiency ratios specifically for Sanwa Holdings Corporation (5929T).
- Interactive Dashboard and Charts: Visual representations of essential valuation metrics for streamlined analysis.
How It Functions
- Download: Obtain the pre-configured Excel file containing financial data for Sanwa Holdings Corporation (5929T).
- Customize: Modify forecasts such as revenue growth, EBITDA %, and WACC to fit your analysis.
- Update Automatically: Enjoy real-time updates for intrinsic value and NPV calculations.
- Test Scenarios: Generate various projections and effortlessly compare their outcomes.
- Make Decisions: Leverage the valuation results to inform your investment strategy.
Why Choose This Calculator for Sanwa Holdings Corporation (5929T)?
- Precise Data: Utilize authentic financial figures from Sanwa Holdings for dependable valuation outputs.
- Flexible Options: Tailor essential variables such as growth rates, WACC, and tax rates to align with your forecasts.
- Efficient: Pre-configured calculations save you the hassle of building from the ground up.
- Professional-Quality Tool: Crafted for investors, analysts, and consultants in the field.
- Easy to Use: Features an intuitive design and clear, step-by-step guidance suitable for all users.
Who Can Benefit from This Product?
- Finance Students: Discover valuation methodologies and implement them with actual market data.
- Researchers: Integrate established financial models into your academic projects or studies.
- Investors: Evaluate your personal assumptions and investigate valuation results for Sanwa Holdings Corporation (5929T).
- Financial Analysts: Enhance your efficiency with a ready-to-use, adaptable DCF model.
- Entrepreneurs: Understand the analytical approaches used for assessing large publicly traded firms like Sanwa Holdings Corporation (5929T).
Contents of the Template
- Pre-Filled Data: Features Sanwa Holdings Corporation’s historical financial data and projections.
- Discounted Cash Flow Model: An editable DCF valuation model complete with automatic calculations.
- Weighted Average Cost of Capital (WACC): A dedicated sheet for WACC calculations based on your custom inputs.
- Key Financial Ratios: Examine Sanwa Holdings Corporation’s profitability, efficiency, and leverage metrics.
- Customizable Inputs: Easily modify revenue growth, profit margins, and tax rates.
- Clear Dashboard: Visual representations and tables that summarize key valuation outcomes.
Disclaimer
All information, articles, and product details provided on this website are for general informational and educational purposes only. We do not claim any ownership over, nor do we intend to infringe upon, any trademarks, copyrights, logos, brand names, or other intellectual property mentioned or depicted on this site. Such intellectual property remains the property of its respective owners, and any references here are made solely for identification or informational purposes, without implying any affiliation, endorsement, or partnership.
We make no representations or warranties, express or implied, regarding the accuracy, completeness, or suitability of any content or products presented. Nothing on this website should be construed as legal, tax, investment, financial, medical, or other professional advice. In addition, no part of this site—including articles or product references—constitutes a solicitation, recommendation, endorsement, advertisement, or offer to buy or sell any securities, franchises, or other financial instruments, particularly in jurisdictions where such activity would be unlawful.
All content is of a general nature and may not address the specific circumstances of any individual or entity. It is not a substitute for professional advice or services. Any actions you take based on the information provided here are strictly at your own risk. You accept full responsibility for any decisions or outcomes arising from your use of this website and agree to release us from any liability in connection with your use of, or reliance upon, the content or products found herein.