
|
Guangzhou Baiyun International Airport Co., Ltd. (600004.SS) Valation DCF |
Entièrement Modifiable: Adapté À Vos Besoins Dans Excel Ou Sheets
Conception Professionnelle: Modèles Fiables Et Conformes Aux Normes Du Secteur
Pré-Construits Pour Une Utilisation Rapide Et Efficace
Compatible MAC/PC, entièrement débloqué
Aucune Expertise N'Est Requise; Facile À Suivre
Guangzhou Baiyun International Airport Co., Ltd. (600004.SS) Bundle
Simplifier Guangzhou Baiyun International Airport Co., Ltd. (60000004SS) Valation avec cette calculatrice DCF personnalisable! Doté de Real Guangzhou Baiyun International Airport Co., Ltd. (60000004SS) Financials and Adjustable Prévisions, vous pouvez tester des scénarios et découvrir Guangzhou Baiyun International Airport Co., Ltd. (600004SS) juste une valeur juste en minutes.
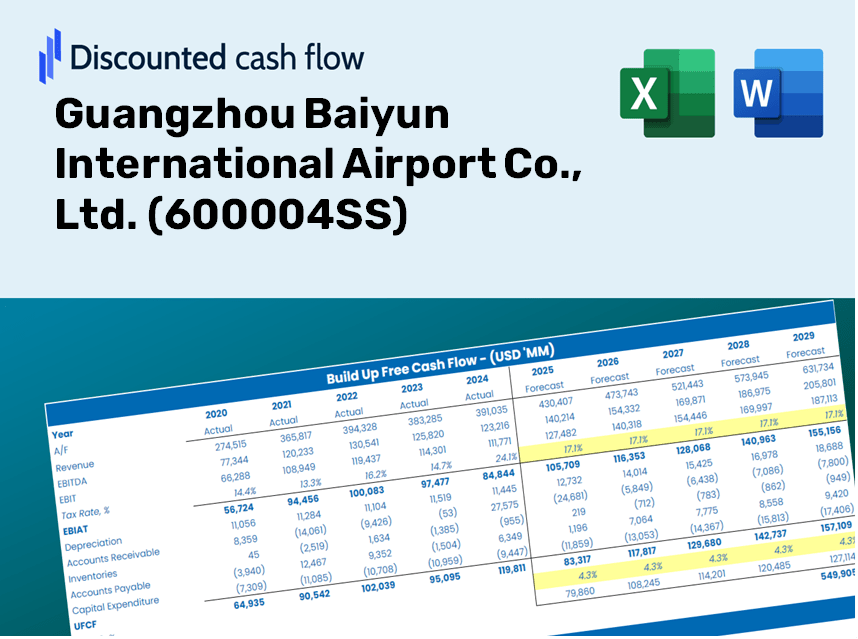
Discounted Cash Flow (DCF) - (USD MM)
| Year | AY1 2020 |
AY2 2021 |
AY3 2022 |
AY4 2023 |
AY5 2024 |
FY1 2025 |
FY2 2026 |
FY3 2027 |
FY4 2028 |
FY5 2029 |
|---|---|---|---|---|---|---|---|---|---|---|
| Revenue | 5,224.6 | 5,180.2 | 3,971.0 | 6,430.9 | 7,423.6 | 8,410.8 | 9,529.2 | 10,796.3 | 12,232.0 | 13,858.6 |
| Revenue Growth, % | 0 | -0.84982 | -23.34 | 61.95 | 15.44 | 13.3 | 13.3 | 13.3 | 13.3 | 13.3 |
| EBITDA | 1,025.5 | 1,027.1 | -3.7 | 2,033.9 | 2,677.2 | 1,800.8 | 2,040.3 | 2,311.6 | 2,619.0 | 2,967.3 |
| EBITDA, % | 19.63 | 19.83 | -0.09281484 | 31.63 | 36.06 | 21.41 | 21.41 | 21.41 | 21.41 | 21.41 |
| Depreciation | 1,638.5 | 1,655.8 | 1,497.6 | 1,429.1 | 1,426.6 | 2,396.7 | 2,715.4 | 3,076.5 | 3,485.6 | 3,949.1 |
| Depreciation, % | 31.36 | 31.96 | 37.72 | 22.22 | 19.22 | 28.5 | 28.5 | 28.5 | 28.5 | 28.5 |
| EBIT | -613.0 | -628.7 | -1,501.3 | 604.9 | 1,250.7 | -595.9 | -675.1 | -764.9 | -866.6 | -981.9 |
| EBIT, % | -11.73 | -12.14 | -37.81 | 9.41 | 16.85 | -7.08 | -7.08 | -7.08 | -7.08 | -7.08 |
| Total Cash | 2,325.0 | 1,573.3 | 2,227.0 | 2,527.8 | 4,731.0 | 3,936.1 | 4,459.5 | 5,052.5 | 5,724.4 | 6,485.6 |
| Total Cash, percent | .0 | .0 | .0 | .0 | .0 | .0 | .0 | .0 | .0 | .0 |
| Account Receivables | 1,124.8 | 1,307.5 | 908.2 | 1,168.2 | 1,083.7 | 1,722.6 | 1,951.6 | 2,211.2 | 2,505.2 | 2,838.3 |
| Account Receivables, % | 21.53 | 25.24 | 22.87 | 18.16 | 14.6 | 20.48 | 20.48 | 20.48 | 20.48 | 20.48 |
| Inventories | 62.5 | 68.0 | 60.4 | 59.0 | 92.7 | 104.3 | 118.1 | 133.8 | 151.6 | 171.8 |
| Inventories, % | 1.2 | 1.31 | 1.52 | 0.91766 | 1.25 | 1.24 | 1.24 | 1.24 | 1.24 | 1.24 |
| Accounts Payable | 756.8 | 789.4 | 875.0 | 986.9 | 838.2 | 1,318.7 | 1,494.1 | 1,692.8 | 1,917.9 | 2,172.9 |
| Accounts Payable, % | 14.48 | 15.24 | 22.03 | 15.35 | 11.29 | 15.68 | 15.68 | 15.68 | 15.68 | 15.68 |
| Capital Expenditure | -1,361.2 | -1,254.6 | -864.1 | -597.2 | -387.7 | -1,455.8 | -1,649.3 | -1,868.7 | -2,117.2 | -2,398.7 |
| Capital Expenditure, % | -26.05 | -24.22 | -21.76 | -9.29 | -5.22 | -17.31 | -17.31 | -17.31 | -17.31 | -17.31 |
| Tax Rate, % | 30.82 | 30.82 | 30.82 | 30.82 | 30.82 | 30.82 | 30.82 | 30.82 | 30.82 | 30.82 |
| EBITAT | -1,033.8 | -481.4 | -1,112.5 | 394.4 | 865.2 | -458.9 | -519.9 | -589.1 | -667.4 | -756.1 |
| Depreciation | ||||||||||
| Changes in Account Receivables | ||||||||||
| Changes in Inventories | ||||||||||
| Changes in Accounts Payable | ||||||||||
| Capital Expenditure | ||||||||||
| UFCF | -1,187.0 | -235.9 | 13.7 | 1,079.5 | 1,806.1 | 312.1 | 478.6 | 542.2 | 614.3 | 696.0 |
| WACC, % | 5.37 | 5.26 | 5.25 | 5.21 | 5.22 | 5.26 | 5.26 | 5.26 | 5.26 | 5.26 |
| PV UFCF | ||||||||||
| SUM PV UFCF | 2,232.4 | |||||||||
| Long Term Growth Rate, % | 2.00 | |||||||||
| Free cash flow (T + 1) | 710 | |||||||||
| Terminal Value | 21,765 | |||||||||
| Present Terminal Value | 16,842 | |||||||||
| Enterprise Value | 19,075 | |||||||||
| Net Debt | -3,065 | |||||||||
| Equity Value | 22,140 | |||||||||
| Diluted Shares Outstanding, MM | 2,374 | |||||||||
| Equity Value Per Share | 9.33 |
What You Will Receive
- Customizable Excel Template: A fully adjustable Excel-based DCF Calculator featuring pre-filled financial data for Guangzhou Baiyun International Airport Co., Ltd. (600004SS).
- Real Data Insights: Access to historical figures and projected estimates (located in the highlighted cells).
- Adjustable Forecasts: Modify forecast variables such as passenger growth, EBITDA margin, and discounted cash flow rate.
- Instant Calculations: Quickly assess how your changes affect the valuation of Guangzhou Baiyun International Airport Co., Ltd. (600004SS).
- Professional Resource: Designed for use by investors, CFOs, consultants, and financial analysts.
- Intuitive Layout: Organized for straightforward navigation and user experience, accompanied by comprehensive instructions.
Key Features
- Comprehensive Airport Financials: Gain access to precise pre-loaded historical data and future forecasts for Guangzhou Baiyun International Airport (600004SS).
- Adjustable Forecast Parameters: Modify highlighted cells for key metrics like WACC, growth rates, and profit margins.
- Real-Time Calculations: Automatic updates for DCF, Net Present Value (NPV), and cash flow evaluations.
- User-Friendly Dashboard: Clear and concise charts and summaries to easily interpret your valuation outcomes.
- Designed for All Skill Levels: A straightforward and intuitive layout tailored for investors, CFOs, and consultants alike.
How It Functions
- Download the Template: Gain immediate access to the Excel-based GBAIA DCF Calculator.
- Input Your Assumptions: Modify the yellow-highlighted cells for growth rates, WACC, margins, and more.
- Instant Calculations: The model instantly recalculates the intrinsic value of Guangzhou Baiyun International Airport Co., Ltd. (600004SS).
- Test Scenarios: Experiment with various assumptions to assess potential changes in valuation.
- Analyze and Decide: Leverage the insights gained to inform your investment or financial evaluation.
Why Opt for Guangzhou Baiyun International Airport Co., Ltd. (600004SS)?
- Reliability: Backed by robust operational data to ensure trustworthiness.
- Adaptability: Crafted to allow users to explore and adjust parameters with ease.
- Efficiency: Bypass the complexities of creating a financial model from the ground up.
- Expert Quality: Engineered with considerations for CFO-level efficiency and functionality.
- Intuitive Interface: Designed for simplicity, making it accessible for users with varying levels of financial expertise.
Who Can Benefit from This Product?
- Aviation Management Students: Explore airport operations and management techniques with real industry data.
- Researchers: Utilize industry models and benchmarks for academic studies or publications.
- Investors: Evaluate your investment strategies and analyze performance metrics for Guangzhou Baiyun International Airport Co., Ltd. (600004SS).
- Market Analysts: Enhance your analysis with an adaptable, ready-to-use financial model tailored for airport operations.
- Airport Executives: Gain valuable insights into how major airports, like Guangzhou Baiyun, are benchmarked against industry standards.
Contents of the Template
- Historical Data: Contains Guangzhou Baiyun International Airport’s previous financial performance and baseline forecasts.
- DCF and Levered DCF Models: Comprehensive templates designed for assessing the intrinsic value of Guangzhou Baiyun International Airport Co., Ltd. (600004SS).
- WACC Sheet: Pre-configured calculations for the Weighted Average Cost of Capital.
- Editable Inputs: Adjust essential variables such as growth rates, EBITDA percentages, and CAPEX estimates.
- Quarterly and Annual Statements: A thorough analysis of Guangzhou Baiyun International Airport’s financial statements.
- Interactive Dashboard: Dynamically visualize valuation results and future projections.
Disclaimer
All information, articles, and product details provided on this website are for general informational and educational purposes only. We do not claim any ownership over, nor do we intend to infringe upon, any trademarks, copyrights, logos, brand names, or other intellectual property mentioned or depicted on this site. Such intellectual property remains the property of its respective owners, and any references here are made solely for identification or informational purposes, without implying any affiliation, endorsement, or partnership.
We make no representations or warranties, express or implied, regarding the accuracy, completeness, or suitability of any content or products presented. Nothing on this website should be construed as legal, tax, investment, financial, medical, or other professional advice. In addition, no part of this site—including articles or product references—constitutes a solicitation, recommendation, endorsement, advertisement, or offer to buy or sell any securities, franchises, or other financial instruments, particularly in jurisdictions where such activity would be unlawful.
All content is of a general nature and may not address the specific circumstances of any individual or entity. It is not a substitute for professional advice or services. Any actions you take based on the information provided here are strictly at your own risk. You accept full responsibility for any decisions or outcomes arising from your use of this website and agree to release us from any liability in connection with your use of, or reliance upon, the content or products found herein.