
|
China World Trade Center Co., Ltd. (600007.SS) Évaluation DCF |
Entièrement Modifiable: Adapté À Vos Besoins Dans Excel Ou Sheets
Conception Professionnelle: Modèles Fiables Et Conformes Aux Normes Du Secteur
Pré-Construits Pour Une Utilisation Rapide Et Efficace
Compatible MAC/PC, entièrement débloqué
Aucune Expertise N'Est Requise; Facile À Suivre
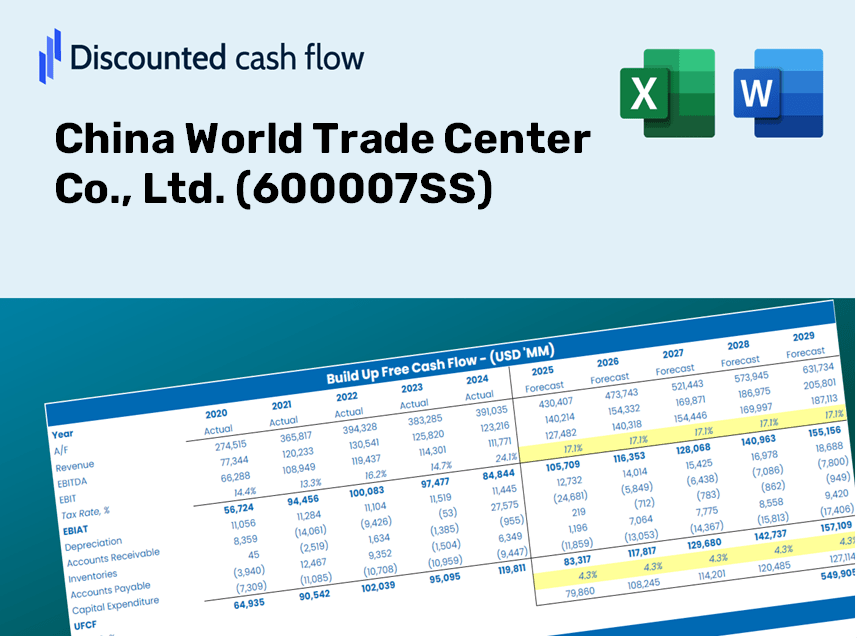
China World Trade Center Co., Ltd. (600007.SS) Bundle
Conçu pour la précision, notre calculatrice DCF (600007SS) vous permet d'évaluer l'évaluation de China World Trade Center Co., Ltd. en utilisant des données financières réelles, tout en offrant une flexibilité complète pour modifier tous les paramètres clés pour des projections améliorées.
Discounted Cash Flow (DCF) - (USD MM)
| Year | AY1 2020 |
AY2 2021 |
AY3 2022 |
AY4 2023 |
AY5 2024 |
FY1 2025 |
FY2 2026 |
FY3 2027 |
FY4 2028 |
FY5 2029 |
|---|---|---|---|---|---|---|---|---|---|---|
| Revenue | 3,097.8 | 3,586.0 | 3,442.3 | 3,957.5 | 3,915.3 | 4,166.5 | 4,433.7 | 4,718.1 | 5,020.7 | 5,342.7 |
| Revenue Growth, % | 0 | 15.76 | -4.01 | 14.97 | -1.07 | 6.41 | 6.41 | 6.41 | 6.41 | 6.41 |
| EBITDA | 1,662.7 | 1,881.3 | 1,883.1 | 2,150.0 | 2,142.7 | 2,249.0 | 2,393.2 | 2,546.7 | 2,710.1 | 2,883.9 |
| EBITDA, % | 53.67 | 52.46 | 54.7 | 54.33 | 54.73 | 53.98 | 53.98 | 53.98 | 53.98 | 53.98 |
| Depreciation | 514.5 | 512.8 | 495.4 | 468.0 | 456.0 | 573.1 | 609.9 | 649.0 | 690.6 | 734.9 |
| Depreciation, % | 16.61 | 14.3 | 14.39 | 11.83 | 11.65 | 13.76 | 13.76 | 13.76 | 13.76 | 13.76 |
| EBIT | 1,148.1 | 1,368.5 | 1,387.7 | 1,682.0 | 1,686.7 | 1,675.9 | 1,783.4 | 1,897.8 | 2,019.5 | 2,149.0 |
| EBIT, % | 37.06 | 38.16 | 40.31 | 42.5 | 43.08 | 40.22 | 40.22 | 40.22 | 40.22 | 40.22 |
| Total Cash | 1,856.0 | 2,962.1 | 3,495.1 | 4,088.7 | 3,986.1 | 3,687.4 | 3,924.0 | 4,175.6 | 4,443.4 | 4,728.4 |
| Total Cash, percent | .0 | .0 | .0 | .0 | .0 | .0 | .0 | .0 | .0 | .0 |
| Account Receivables | 463.9 | 377.2 | 382.7 | 268.0 | 228.6 | 410.2 | 436.5 | 464.5 | 494.2 | 525.9 |
| Account Receivables, % | 14.97 | 10.52 | 11.12 | 6.77 | 5.84 | 9.84 | 9.84 | 9.84 | 9.84 | 9.84 |
| Inventories | 34.0 | 32.7 | 32.1 | 32.3 | 30.7 | 37.9 | 40.3 | 42.9 | 45.6 | 48.5 |
| Inventories, % | 1.1 | 0.91315 | 0.93337 | 0.81591 | 0.78362 | 0.90861 | 0.90861 | 0.90861 | 0.90861 | 0.90861 |
| Accounts Payable | 72.7 | 67.1 | 84.2 | 97.0 | 111.4 | 99.7 | 106.0 | 112.9 | 120.1 | 127.8 |
| Accounts Payable, % | 2.35 | 1.87 | 2.45 | 2.45 | 2.85 | 2.39 | 2.39 | 2.39 | 2.39 | 2.39 |
| Capital Expenditure | -274.6 | -145.0 | -70.3 | -66.0 | -68.3 | -153.0 | -162.8 | -173.3 | -184.4 | -196.2 |
| Capital Expenditure, % | -8.86 | -4.04 | -2.04 | -1.67 | -1.74 | -3.67 | -3.67 | -3.67 | -3.67 | -3.67 |
| Tax Rate, % | 25.09 | 25.09 | 25.09 | 25.09 | 25.09 | 25.09 | 25.09 | 25.09 | 25.09 | 25.09 |
| EBITAT | 857.6 | 1,025.3 | 1,036.6 | 1,260.5 | 1,263.6 | 1,254.1 | 1,334.6 | 1,420.2 | 1,511.3 | 1,608.2 |
| Depreciation | ||||||||||
| Changes in Account Receivables | ||||||||||
| Changes in Inventories | ||||||||||
| Changes in Accounts Payable | ||||||||||
| Capital Expenditure | ||||||||||
| UFCF | 672.3 | 1,475.4 | 1,474.0 | 1,789.8 | 1,706.7 | 1,473.7 | 1,759.3 | 1,872.1 | 1,992.2 | 2,119.9 |
| WACC, % | 7.93 | 7.94 | 7.93 | 7.94 | 7.94 | 7.94 | 7.94 | 7.94 | 7.94 | 7.94 |
| PV UFCF | ||||||||||
| SUM PV UFCF | 7,279.2 | |||||||||
| Long Term Growth Rate, % | 2.00 | |||||||||
| Free cash flow (T + 1) | 2,162 | |||||||||
| Terminal Value | 36,433 | |||||||||
| Present Terminal Value | 24,870 | |||||||||
| Enterprise Value | 32,150 | |||||||||
| Net Debt | -2,865 | |||||||||
| Equity Value | 35,015 | |||||||||
| Diluted Shares Outstanding, MM | 1,010 | |||||||||
| Equity Value Per Share | 34.67 |
What Awaits You
- Authentic CWTC Financial Data: Preloaded with China World Trade Center Co., Ltd.’s historical and projected figures for accurate analysis.
- Completely Customizable Template: Easily adjust crucial inputs such as revenue growth, WACC, and EBITDA %.
- Instant Calculations: Watch the intrinsic value of CWTC update in real-time as you make changes.
- Expert Valuation Tool: Crafted for investors, analysts, and consultants pursuing precise DCF results.
- Intuitive Design: Straightforward layout and clear guidance suitable for users of all skill levels.
Key Features
- Customizable Financial Inputs: Adjust essential metrics such as revenue growth, EBITDA percentage, and capital expenditures.
- Instant DCF Valuation: Provides immediate calculations of intrinsic value, NPV, and additional financial outputs.
- High Precision Results: Leverages China World Trade Center Co., Ltd.'s (600007SS) actual financial data for accurate valuation findings.
- Streamlined Scenario Analysis: Effortlessly examine various assumptions and assess their potential impacts.
- Efficiency-Oriented Solution: Simplifies the process by removing the need to create intricate valuation models from the ground up.
How It Works
- Step 1: Download the Excel file for China World Trade Center Co., Ltd. (600007SS).
- Step 2: Examine the pre-filled financial data and projections for China World Trade Center Co., Ltd. (600007SS).
- Step 3: Adjust key parameters such as revenue growth, WACC, and tax rates (highlighted cells).
- Step 4: Observe the DCF model refresh in real-time as you modify assumptions.
- Step 5: Evaluate the results and utilize them for your investment strategies.
Why Choose This Calculator for China World Trade Center Co., Ltd. (600007SS)?
- Designed for Industry Experts: A sophisticated tool utilized by financial analysts, CFOs, and consultants.
- Accurate Financial Data: Comprehensive historical and projected financials for China World Trade Center preloaded for precision.
- Scenario Analysis: Effortlessly simulate various forecasts and assumptions.
- Clear and Concise Outputs: Automatically computes intrinsic value, NPV, and essential metrics.
- User-Friendly: Step-by-step guidance simplifies the entire process.
Who Can Benefit from This Product?
- Investors: Utilize a top-tier valuation tool to make informed investment decisions regarding China World Trade Center Co., Ltd. (600007SS).
- Financial Analysts: Save valuable time with a customizable DCF model tailored for analyzing (600007SS).
- Consultants: Easily modify the template for impactful presentations or reports for clients interested in (600007SS).
- Finance Enthusiasts: Enhance your knowledge of valuation methods through practical, real-life examples related to (600007SS).
- Educators and Students: Employ this resource as a hands-on learning tool in finance courses focused on (600007SS).
Contents of the Template
- Pre-Filled DCF Model: China World Trade Center Co., Ltd.’s financial data preloaded for immediate application.
- WACC Calculator: Comprehensive calculations for the Weighted Average Cost of Capital.
- Financial Ratios: Analyze China World Trade Center Co., Ltd.’s profitability, leverage, and efficiency metrics.
- Editable Inputs: Adjust variables such as growth rates, margins, and capital expenditures to align with your scenarios.
- Financial Statements: Access annual and quarterly reports for in-depth analysis.
- Interactive Dashboard: Effortlessly visualize essential valuation metrics and outcomes.
Disclaimer
All information, articles, and product details provided on this website are for general informational and educational purposes only. We do not claim any ownership over, nor do we intend to infringe upon, any trademarks, copyrights, logos, brand names, or other intellectual property mentioned or depicted on this site. Such intellectual property remains the property of its respective owners, and any references here are made solely for identification or informational purposes, without implying any affiliation, endorsement, or partnership.
We make no representations or warranties, express or implied, regarding the accuracy, completeness, or suitability of any content or products presented. Nothing on this website should be construed as legal, tax, investment, financial, medical, or other professional advice. In addition, no part of this site—including articles or product references—constitutes a solicitation, recommendation, endorsement, advertisement, or offer to buy or sell any securities, franchises, or other financial instruments, particularly in jurisdictions where such activity would be unlawful.
All content is of a general nature and may not address the specific circumstances of any individual or entity. It is not a substitute for professional advice or services. Any actions you take based on the information provided here are strictly at your own risk. You accept full responsibility for any decisions or outcomes arising from your use of this website and agree to release us from any liability in connection with your use of, or reliance upon, the content or products found herein.