
|
Shanghai International Port Co., Ltd. (600018.SS) Évaluation DCF |
Entièrement Modifiable: Adapté À Vos Besoins Dans Excel Ou Sheets
Conception Professionnelle: Modèles Fiables Et Conformes Aux Normes Du Secteur
Pré-Construits Pour Une Utilisation Rapide Et Efficace
Compatible MAC/PC, entièrement débloqué
Aucune Expertise N'Est Requise; Facile À Suivre
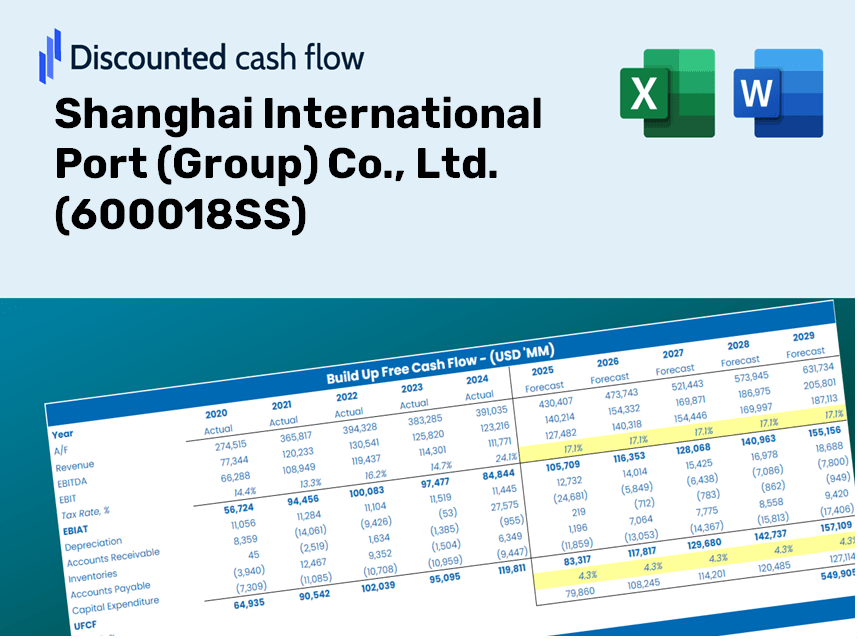
Shanghai International Port (Group) Co., Ltd. (600018.SS) Bundle
Gagnez la maîtrise sur votre analyse d'évaluation de votre port international de Shanghai (groupe), Ltd. (600018SS) à l'aide de notre calculatrice sophistiquée DCF! Ce modèle Excel est préchargé avec des données réelles (600018SS), vous permettant d'ajuster les prévisions et les hypothèses pour déterminer avec précision la valeur intrinsèque de Shanghai International Port (Group) Co., Ltd.
Discounted Cash Flow (DCF) - (USD MM)
| Year | AY1 2020 |
AY2 2021 |
AY3 2022 |
AY4 2023 |
AY5 2024 |
FY1 2025 |
FY2 2026 |
FY3 2027 |
FY4 2028 |
FY5 2029 |
|---|---|---|---|---|---|---|---|---|---|---|
| Revenue | 26,119.5 | 34,288.7 | 37,279.8 | 37,551.6 | 38,117.0 | 42,141.6 | 46,591.2 | 51,510.5 | 56,949.3 | 62,962.4 |
| Revenue Growth, % | 0 | 31.28 | 8.72 | 0.72898 | 1.51 | 10.56 | 10.56 | 10.56 | 10.56 | 10.56 |
| EBITDA | 8,912.5 | 11,961.9 | 11,960.7 | 13,262.2 | 12,779.4 | 14,322.7 | 15,835.0 | 17,506.9 | 19,355.4 | 21,399.1 |
| EBITDA, % | 34.12 | 34.89 | 32.08 | 35.32 | 33.53 | 33.99 | 33.99 | 33.99 | 33.99 | 33.99 |
| Depreciation | 3,425.0 | 3,294.6 | 3,287.0 | 3,486.4 | 3,577.0 | 4,231.6 | 4,678.4 | 5,172.3 | 5,718.5 | 6,322.3 |
| Depreciation, % | 13.11 | 9.61 | 8.82 | 9.28 | 9.38 | 10.04 | 10.04 | 10.04 | 10.04 | 10.04 |
| EBIT | 5,487.5 | 8,667.3 | 8,673.7 | 9,775.8 | 9,202.4 | 10,091.1 | 11,156.6 | 12,334.6 | 13,636.9 | 15,076.8 |
| EBIT, % | 21.01 | 25.28 | 23.27 | 26.03 | 24.14 | 23.95 | 23.95 | 23.95 | 23.95 | 23.95 |
| Total Cash | 20,822.5 | 28,621.4 | 26,843.7 | 35,722.0 | 32,831.1 | 35,100.4 | 38,806.6 | 42,904.0 | 47,434.1 | 52,442.4 |
| Total Cash, percent | .0 | .0 | .0 | .0 | .0 | .0 | .0 | .0 | .0 | .0 |
| Account Receivables | 3,422.0 | 3,470.1 | 4,087.0 | 3,830.8 | 5,154.3 | 4,880.7 | 5,396.1 | 5,965.8 | 6,595.7 | 7,292.1 |
| Account Receivables, % | 13.1 | 10.12 | 10.96 | 10.2 | 13.52 | 11.58 | 11.58 | 11.58 | 11.58 | 11.58 |
| Inventories | 15,794.1 | 14,298.0 | 11,538.3 | 10,282.3 | 7,457.7 | 15,176.5 | 16,778.9 | 18,550.5 | 20,509.2 | 22,674.7 |
| Inventories, % | 60.47 | 41.7 | 30.95 | 27.38 | 19.57 | 36.01 | 36.01 | 36.01 | 36.01 | 36.01 |
| Accounts Payable | 4,941.7 | 5,635.1 | 5,765.8 | 6,639.7 | 6,177.3 | 7,139.5 | 7,893.3 | 8,726.7 | 9,648.1 | 10,666.8 |
| Accounts Payable, % | 18.92 | 16.43 | 15.47 | 17.68 | 16.21 | 16.94 | 16.94 | 16.94 | 16.94 | 16.94 |
| Capital Expenditure | -4,127.5 | -4,326.0 | -5,745.6 | -8,002.4 | -6,249.4 | -6,872.2 | -7,597.8 | -8,400.0 | -9,286.9 | -10,267.5 |
| Capital Expenditure, % | -15.8 | -12.62 | -15.41 | -21.31 | -16.4 | -16.31 | -16.31 | -16.31 | -16.31 | -16.31 |
| Tax Rate, % | 20.1 | 20.1 | 20.1 | 20.1 | 20.1 | 20.1 | 20.1 | 20.1 | 20.1 | 20.1 |
| EBITAT | 4,311.0 | 7,470.3 | 7,423.6 | 7,944.4 | 7,352.8 | 8,305.1 | 9,182.0 | 10,151.4 | 11,223.3 | 12,408.3 |
| Depreciation | ||||||||||
| Changes in Account Receivables | ||||||||||
| Changes in Inventories | ||||||||||
| Changes in Accounts Payable | ||||||||||
| Capital Expenditure | ||||||||||
| UFCF | -10,666.0 | 8,580.4 | 7,238.5 | 5,814.5 | 5,719.0 | -818.5 | 4,898.6 | 5,415.9 | 5,987.7 | 6,619.9 |
| WACC, % | 4.62 | 4.69 | 4.68 | 4.64 | 4.63 | 4.65 | 4.65 | 4.65 | 4.65 | 4.65 |
| PV UFCF | ||||||||||
| SUM PV UFCF | 18,680.5 | |||||||||
| Long Term Growth Rate, % | 2.00 | |||||||||
| Free cash flow (T + 1) | 6,752 | |||||||||
| Terminal Value | 254,461 | |||||||||
| Present Terminal Value | 202,699 | |||||||||
| Enterprise Value | 221,379 | |||||||||
| Net Debt | 6,171 | |||||||||
| Equity Value | 215,209 | |||||||||
| Diluted Shares Outstanding, MM | 23,235 | |||||||||
| Equity Value Per Share | 9.26 |
Benefits You Will Receive
- Customizable Excel Template: A fully adjustable Excel-based DCF Calculator featuring pre-filled financials for Shanghai International Port (Group) Co., Ltd. (600018SS).
- Market Data: Access to historical figures and forward-looking estimates (highlighted in the yellow cells).
- Adjustable Forecasting: Modify forecast parameters such as revenue growth, EBITDA %, and WACC at your discretion.
- Instant Calculations: Quickly observe how your inputs affect the valuation of Shanghai International Port (Group) Co., Ltd. (600018SS).
- Professional Resource: Designed for use by investors, CFOs, consultants, and financial analysts.
- Intuitive Interface: Organized for simplicity and ease of navigation, complete with step-by-step guidance.
Key Features
- Comprehensive SHIP Data: Includes Shanghai International Port's historical financials and future projections.
- Customizable Variables: Fine-tune revenue growth, profit margins, WACC, tax rates, and capital investments.
- Dynamic Valuation Framework: Instant updates to Net Present Value (NPV) and intrinsic value based on user inputs.
- Scenario Analysis: Develop various forecasting scenarios to evaluate different valuation results.
- User-Friendly Interface: Intuitive design catering to both industry professionals and newcomers.
How It Functions
- Step 1: Download the prebuilt Excel template featuring Shanghai International Port (Group) Co., Ltd. (600018SS) data.
- Step 2: Review the pre-populated sheets to familiarize yourself with the essential metrics.
- Step 3: Modify forecasts and assumptions in the editable yellow cells (WACC, growth, margins).
- Step 4: Instantly see recalibrated results, including the intrinsic value of Shanghai International Port (Group) Co., Ltd. (600018SS).
- Step 5: Make well-informed investment choices or create reports using the generated outputs.
Why Choose Our Port Management Solutions?
- Accuracy: Leverage real-time data from Shanghai International Port (600018SS) for precise insights.
- Flexibility: Tailored for users to easily adapt and alter parameters as needed.
- Time-Saving: Eliminate the complexities of developing a port management model from the ground up.
- Professional-Grade: Crafted with the expertise and attention to detail expected from industry leaders.
- User-Friendly: Intuitive design that accommodates users of all skill levels, including those new to port management.
Who Can Benefit from Shanghai International Port (Group) Co., Ltd. (600018SS)?
- Investors: Make informed investment choices with insights from a leading port operator.
- Financial Analysts: Utilize comprehensive data and reports to streamline your analysis workflow.
- Consultants: Easily modify our resources for client presentations or strategic assessments.
- Maritime Enthusiasts: Enhance your knowledge of the shipping industry with real-case studies and metrics.
- Educators and Students: Leverage this as a practical resource for courses focused on logistics and finance.
What the Template Includes
- Operating and Balance Sheet Data: Pre-filled historical data and forecasts for Shanghai International Port (Group) Co., Ltd. (600018SS), such as revenue, EBITDA, EBIT, and capital expenditures.
- WACC Calculation: A specific sheet dedicated to calculating the Weighted Average Cost of Capital (WACC), including key parameters like Beta, risk-free rate, and share price.
- DCF Valuation (Unlevered and Levered): Customizable Discounted Cash Flow models that illustrate intrinsic value with comprehensive calculations.
- Financial Statements: Pre-loaded financial statements (both annual and quarterly) to aid in thorough analysis.
- Key Ratios: A collection of profitability, leverage, and efficiency ratios pertinent to Shanghai International Port (Group) Co., Ltd. (600018SS).
- Dashboard and Charts: A visual summary providing an overview of valuation outputs and assumptions for easier result analysis.
Disclaimer
All information, articles, and product details provided on this website are for general informational and educational purposes only. We do not claim any ownership over, nor do we intend to infringe upon, any trademarks, copyrights, logos, brand names, or other intellectual property mentioned or depicted on this site. Such intellectual property remains the property of its respective owners, and any references here are made solely for identification or informational purposes, without implying any affiliation, endorsement, or partnership.
We make no representations or warranties, express or implied, regarding the accuracy, completeness, or suitability of any content or products presented. Nothing on this website should be construed as legal, tax, investment, financial, medical, or other professional advice. In addition, no part of this site—including articles or product references—constitutes a solicitation, recommendation, endorsement, advertisement, or offer to buy or sell any securities, franchises, or other financial instruments, particularly in jurisdictions where such activity would be unlawful.
All content is of a general nature and may not address the specific circumstances of any individual or entity. It is not a substitute for professional advice or services. Any actions you take based on the information provided here are strictly at your own risk. You accept full responsibility for any decisions or outcomes arising from your use of this website and agree to release us from any liability in connection with your use of, or reliance upon, the content or products found herein.