
|
Henan Zhongyuan Expressway Company Limited (600020.SS) Valation DCF |
Entièrement Modifiable: Adapté À Vos Besoins Dans Excel Ou Sheets
Conception Professionnelle: Modèles Fiables Et Conformes Aux Normes Du Secteur
Pré-Construits Pour Une Utilisation Rapide Et Efficace
Compatible MAC/PC, entièrement débloqué
Aucune Expertise N'Est Requise; Facile À Suivre
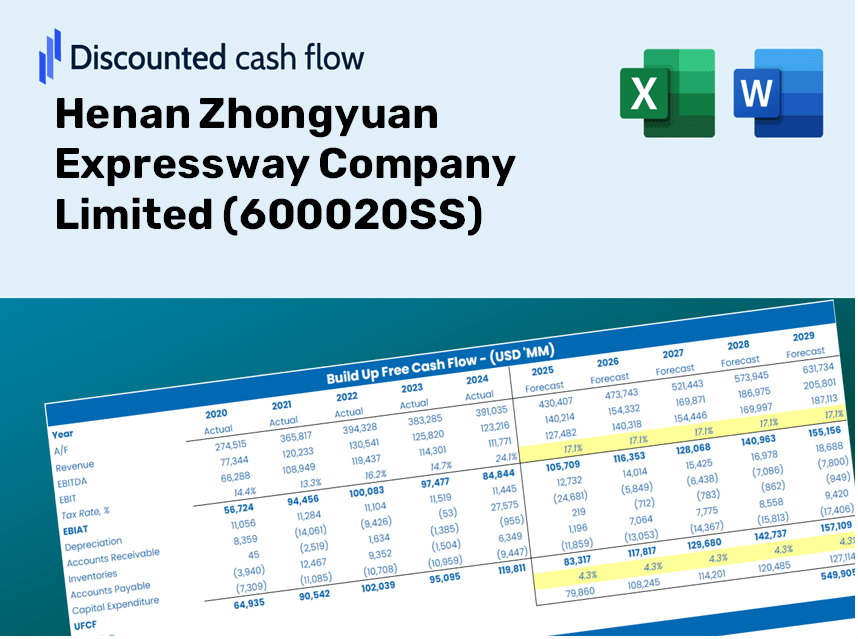
Henan Zhongyuan Expressway Company Limited (600020.SS) Bundle
Que vous soyez un investisseur ou un analyste, cette calculatrice DCF (600020SS) est votre ressource incontournable pour une évaluation précise. Chargé de données réelles de Henan Zhongyuan Expressway Company Limited, vous pouvez ajuster les prévisions et observer instantanément les effets.
Discounted Cash Flow (DCF) - (USD MM)
| Year | AY1 2020 |
AY2 2021 |
AY3 2022 |
AY4 2023 |
AY5 2024 |
FY1 2025 |
FY2 2026 |
FY3 2027 |
FY4 2028 |
FY5 2029 |
|---|---|---|---|---|---|---|---|---|---|---|
| Revenue | 5,076.8 | 5,606.6 | 7,410.5 | 5,702.8 | 6,969.1 | 7,171.0 | 7,378.7 | 7,592.4 | 7,812.3 | 8,038.6 |
| Revenue Growth, % | 0 | 10.44 | 32.17 | -23.04 | 22.2 | 2.9 | 2.9 | 2.9 | 2.9 | 2.9 |
| EBITDA | 3,039.9 | 3,549.6 | 2,333.8 | 3,201.8 | 2,935.8 | 3,627.8 | 3,732.9 | 3,841.0 | 3,952.3 | 4,066.8 |
| EBITDA, % | 59.88 | 63.31 | 31.49 | 56.15 | 42.13 | 50.59 | 50.59 | 50.59 | 50.59 | 50.59 |
| Depreciation | 1,702.9 | 1,555.2 | 1,101.5 | 1,155.0 | 1,191.3 | 1,627.7 | 1,674.9 | 1,723.4 | 1,773.3 | 1,824.6 |
| Depreciation, % | 33.54 | 27.74 | 14.86 | 20.25 | 17.09 | 22.7 | 22.7 | 22.7 | 22.7 | 22.7 |
| EBIT | 1,337.1 | 1,994.3 | 1,232.2 | 2,046.8 | 1,744.5 | 2,000.1 | 2,058.1 | 2,117.7 | 2,179.0 | 2,242.1 |
| EBIT, % | 26.34 | 35.57 | 16.63 | 35.89 | 25.03 | 27.89 | 27.89 | 27.89 | 27.89 | 27.89 |
| Total Cash | 954.1 | 1,192.8 | 960.5 | 482.7 | 497.4 | 984.3 | 1,012.8 | 1,042.2 | 1,072.4 | 1,103.4 |
| Total Cash, percent | .0 | .0 | .0 | .0 | .0 | .0 | .0 | .0 | .0 | .0 |
| Account Receivables | 258.3 | 356.1 | 266.3 | 703.7 | 1,357.8 | 672.0 | 691.4 | 711.5 | 732.1 | 753.3 |
| Account Receivables, % | 5.09 | 6.35 | 3.59 | 12.34 | 19.48 | 9.37 | 9.37 | 9.37 | 9.37 | 9.37 |
| Inventories | 3,765.1 | 3,869.0 | 4,764.8 | 4,819.1 | 4,742.2 | 5,163.3 | 5,312.9 | 5,466.8 | 5,625.1 | 5,788.0 |
| Inventories, % | 74.16 | 69.01 | 64.3 | 84.5 | 68.05 | 72 | 72 | 72 | 72 | 72 |
| Accounts Payable | 609.3 | 787.4 | 586.7 | 813.1 | 317.2 | 756.9 | 778.8 | 801.3 | 824.5 | 848.4 |
| Accounts Payable, % | 12 | 14.04 | 7.92 | 14.26 | 4.55 | 10.55 | 10.55 | 10.55 | 10.55 | 10.55 |
| Capital Expenditure | -957.8 | -350.8 | -3,543.9 | -1,200.2 | -3,053.1 | -1,976.3 | -2,033.6 | -2,092.5 | -2,153.1 | -2,215.5 |
| Capital Expenditure, % | -18.87 | -6.26 | -47.82 | -21.05 | -43.81 | -27.56 | -27.56 | -27.56 | -27.56 | -27.56 |
| Tax Rate, % | 26.61 | 26.61 | 26.61 | 26.61 | 26.61 | 26.61 | 26.61 | 26.61 | 26.61 | 26.61 |
| EBITAT | 1,128.2 | 1,572.1 | 966.2 | 1,537.0 | 1,280.3 | 1,560.5 | 1,605.7 | 1,652.2 | 1,700.1 | 1,749.3 |
| Depreciation | ||||||||||
| Changes in Account Receivables | ||||||||||
| Changes in Inventories | ||||||||||
| Changes in Accounts Payable | ||||||||||
| Capital Expenditure | ||||||||||
| UFCF | -1,540.7 | 2,752.9 | -2,482.8 | 1,226.5 | -1,654.7 | 1,916.2 | 1,099.9 | 1,131.8 | 1,164.5 | 1,198.3 |
| WACC, % | 3.56 | 3.42 | 3.41 | 3.32 | 3.27 | 3.4 | 3.4 | 3.4 | 3.4 | 3.4 |
| PV UFCF | ||||||||||
| SUM PV UFCF | 5,939.0 | |||||||||
| Long Term Growth Rate, % | 3.00 | |||||||||
| Free cash flow (T + 1) | 1,234 | |||||||||
| Terminal Value | 312,260 | |||||||||
| Present Terminal Value | 264,249 | |||||||||
| Enterprise Value | 270,188 | |||||||||
| Net Debt | 31,263 | |||||||||
| Equity Value | 238,924 | |||||||||
| Diluted Shares Outstanding, MM | 2,626 | |||||||||
| Equity Value Per Share | 90.97 |
Benefits You Will Receive
- Authentic Henan Zhongyuan Financials: Features both historical and projected data for precise valuation.
- Customizable Inputs: Adjust WACC, tax rates, revenue growth, and capital expenditures as needed.
- Automated Calculations: Intrinsic value and NPV are dynamically computed.
- Scenario Analysis: Explore various scenarios to assess the future performance of Henan Zhongyuan.
- User-Friendly Design: Designed for professionals while remaining accessible to newcomers.
Key Features
- 🔍 Real-Life HENAN ZY Financials: Pre-filled historical and projected data for Henan Zhongyuan Expressway Company Limited (600020SS).
- ✏️ Fully Customizable Inputs: Adjust all critical parameters (yellow cells) like WACC, growth %, and tax rates.
- 📊 Professional DCF Valuation: Built-in formulas calculate Henan Zhongyuan’s intrinsic value using the Discounted Cash Flow method.
- ⚡ Instant Results: Visualize Henan Zhongyuan’s valuation instantly after making changes.
- Scenario Analysis: Test and compare outcomes for various financial assumptions side-by-side.
How It Functions
- Step 1: Download the Excel spreadsheet.
- Step 2: Examine Henan Zhongyuan Expressway Company Limited's pre-filled financial data and projections.
- Step 3: Adjust key inputs such as revenue growth, WACC, and tax rates (highlighted cells).
- Step 4: Observe the DCF model refresh in real-time as you modify your assumptions.
- Step 5: Evaluate the outputs and leverage the results for your investment decisions regarding (600020SS).
Why Opt for This Calculator?
- Precision: Accurate financial data from Henan Zhongyuan Expressway Company Limited (600020SS) ensures reliable results.
- Adaptability: Built for users to easily modify and explore various input parameters.
- Efficiency: Eliminate the complexity of constructing a DCF model from the ground up.
- High-Quality: Crafted with the expertise and standards expected at the CFO level.
- Intuitive: Designed for ease of use, suitable for individuals with limited financial modeling skills.
Who Can Benefit from This Product?
- Finance Students: Master valuation methods and apply your knowledge using real-world data.
- Academics: Enhance your teaching materials or research with industry-standard models.
- Investors: Validate your assumptions and evaluate the valuation results for Henan Zhongyuan Expressway Company Limited (600020SS).
- Analysts: Optimize your processes with a ready-made, customizable DCF model.
- Small Business Owners: Understand the analytical approaches used for evaluating large public firms like Henan Zhongyuan Expressway Company Limited (600020SS).
Contents of the Template
- Operating and Balance Sheet Data: Pre-filled historical data and forecasts for Henan Zhongyuan Expressway Company Limited (600020SS), including revenue, EBITDA, EBIT, and capital expenditures.
- WACC Calculation: A separate sheet dedicated to calculating the Weighted Average Cost of Capital (WACC), featuring key parameters such as Beta, risk-free rate, and share price.
- DCF Valuation (Unlevered and Levered): Customizable Discounted Cash Flow models that provide intrinsic value estimates along with comprehensive calculations.
- Financial Statements: Pre-loaded annual and quarterly financial statements to facilitate thorough analysis.
- Key Ratios: A collection of ratios assessing profitability, leverage, and efficiency specific to Henan Zhongyuan Expressway Company Limited (600020SS).
- Dashboard and Charts: A visual overview of valuation results and assumptions, allowing for straightforward analysis of findings.
Disclaimer
All information, articles, and product details provided on this website are for general informational and educational purposes only. We do not claim any ownership over, nor do we intend to infringe upon, any trademarks, copyrights, logos, brand names, or other intellectual property mentioned or depicted on this site. Such intellectual property remains the property of its respective owners, and any references here are made solely for identification or informational purposes, without implying any affiliation, endorsement, or partnership.
We make no representations or warranties, express or implied, regarding the accuracy, completeness, or suitability of any content or products presented. Nothing on this website should be construed as legal, tax, investment, financial, medical, or other professional advice. In addition, no part of this site—including articles or product references—constitutes a solicitation, recommendation, endorsement, advertisement, or offer to buy or sell any securities, franchises, or other financial instruments, particularly in jurisdictions where such activity would be unlawful.
All content is of a general nature and may not address the specific circumstances of any individual or entity. It is not a substitute for professional advice or services. Any actions you take based on the information provided here are strictly at your own risk. You accept full responsibility for any decisions or outcomes arising from your use of this website and agree to release us from any liability in connection with your use of, or reliance upon, the content or products found herein.