
|
Route du Sichuan & Bridge Co., Ltd (600039.SS) Évaluation DCF |
Entièrement Modifiable: Adapté À Vos Besoins Dans Excel Ou Sheets
Conception Professionnelle: Modèles Fiables Et Conformes Aux Normes Du Secteur
Pré-Construits Pour Une Utilisation Rapide Et Efficace
Compatible MAC/PC, entièrement débloqué
Aucune Expertise N'Est Requise; Facile À Suivre
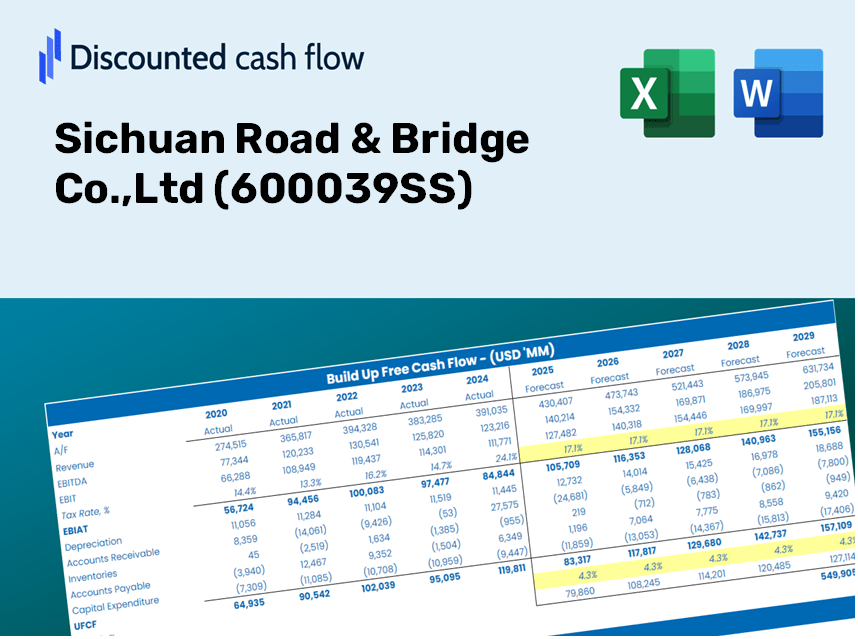
Sichuan Road & Bridge Co.,Ltd (600039.SS) Bundle
Gardez un aperçu de votre route du Sichuan & Analyse d'évaluation de Bridge Co., Ltd (600039SS) utilisant notre calculatrice sophistiquée DCF! Entièrement équipé de données réelles (600039SS), ce modèle Excel vous permet d'ajuster les prévisions et les hypothèses pour déterminer avec précision la valeur intrinsèque de Sichuan Road & Bridge Co., Ltd.
What You Will Receive
- Adjustable Forecast Inputs: Modify key assumptions (growth %, margins, WACC) to explore various scenarios.
- Comprehensive Financial Data: Sichuan Road & Bridge Co., Ltd's financial information pre-loaded to facilitate your analysis.
- Instant DCF Calculations: The template automatically computes Net Present Value (NPV) and intrinsic value for you.
- Tailored and Professional Design: A sleek Excel model that can be customized to meet your valuation requirements.
- Designed for Analysts and Investors: Perfect for assessing projections, validating strategies, and enhancing efficiency.
Key Features
- Comprehensive Data Sets: Access Sichuan Road & Bridge Co., Ltd's historical financial reports and pre-filled projections.
- Customizable Inputs: Modify WACC, tax rates, revenue growth, and EBITDA margins to suit your analysis.
- Real-Time Insights: Watch as the intrinsic value of Sichuan Road & Bridge Co., Ltd. (600039SS) recalibrates instantly.
- Intuitive Visualizations: Interactive dashboard charts present valuation outcomes and essential metrics clearly.
- Designed for Precision: A professional-grade tool tailored for analysts, investors, and finance professionals.
How It Works
- Step 1: Download the Excel file.
- Step 2: Review the pre-filled data for Sichuan Road & Bridge Co., Ltd (600039SS) (historical and projected).
- Step 3: Modify key assumptions (yellow cells) based on your analysis.
- Step 4: Observe automatic recalculations for the intrinsic value of Sichuan Road & Bridge Co., Ltd (600039SS).
- Step 5: Utilize the outputs for investment decisions or reporting.
Why Choose Sichuan Road & Bridge Co., Ltd (600039SS)?
- Save Time: Skip the hassle of building a financial model from scratch – it’s ready for immediate use.
- Enhance Accuracy: Dependable financial data and formulas minimize valuation errors.
- Completely Customizable: Adapt the model to suit your specific assumptions and forecasts.
- User-Friendly: Intuitive charts and outputs make the results straightforward to analyze.
- Endorsed by Professionals: Crafted for experts who prioritize precision and ease of use.
Who Can Benefit from This Product?
- Investors: Evaluate Sichuan Road & Bridge Co., Ltd's (600039SS) valuation prior to making investment decisions.
- CFOs and Financial Analysts: Optimize valuation workflows and assess financial forecasts.
- Startup Founders: Gain insights into the valuation methods of large public enterprises like Sichuan Road & Bridge Co., Ltd.
- Consultants: Provide comprehensive valuation reports for your clients.
- Students and Educators: Utilize authentic data to practice and instruct on valuation methodologies.
Contents of the Template
- Pre-Filled Data: Contains Sichuan Road & Bridge Co., Ltd’s historical financials and projections.
- Discounted Cash Flow Model: An editable DCF valuation model featuring automatic calculations.
- Weighted Average Cost of Capital (WACC): A dedicated worksheet for WACC calculations based on user-defined inputs.
- Key Financial Ratios: Evaluate Sichuan Road & Bridge’s profitability, efficiency, and financial leverage.
- Customizable Inputs: Easily adjust revenue growth rates, profit margins, and tax rates.
- User-Friendly Dashboard: Visual displays and tables summarizing essential valuation outcomes.
Disclaimer
All information, articles, and product details provided on this website are for general informational and educational purposes only. We do not claim any ownership over, nor do we intend to infringe upon, any trademarks, copyrights, logos, brand names, or other intellectual property mentioned or depicted on this site. Such intellectual property remains the property of its respective owners, and any references here are made solely for identification or informational purposes, without implying any affiliation, endorsement, or partnership.
We make no representations or warranties, express or implied, regarding the accuracy, completeness, or suitability of any content or products presented. Nothing on this website should be construed as legal, tax, investment, financial, medical, or other professional advice. In addition, no part of this site—including articles or product references—constitutes a solicitation, recommendation, endorsement, advertisement, or offer to buy or sell any securities, franchises, or other financial instruments, particularly in jurisdictions where such activity would be unlawful.
All content is of a general nature and may not address the specific circumstances of any individual or entity. It is not a substitute for professional advice or services. Any actions you take based on the information provided here are strictly at your own risk. You accept full responsibility for any decisions or outcomes arising from your use of this website and agree to release us from any liability in connection with your use of, or reliance upon, the content or products found herein.