
|
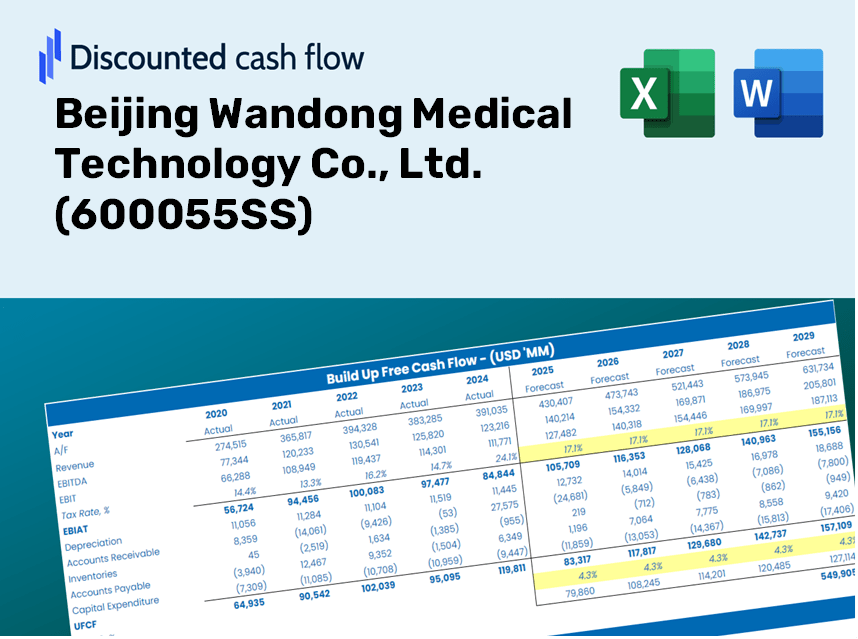
Beijing Wandong Medical Technology Co., Ltd. (600055.SS) Évaluation DCF |
Entièrement Modifiable: Adapté À Vos Besoins Dans Excel Ou Sheets
Conception Professionnelle: Modèles Fiables Et Conformes Aux Normes Du Secteur
Pré-Construits Pour Une Utilisation Rapide Et Efficace
Compatible MAC/PC, entièrement débloqué
Aucune Expertise N'Est Requise; Facile À Suivre
Beijing Wandong Medical Technology Co., Ltd. (600055.SS) Bundle
Évaluez les perspectives financières de Pékin Wandong Medical Technology Co., Ltd. (600055SS) avec une précision experte! Cette calculatrice DCF (600055SS) fournit des données financières pré-remplies et offre une pleine flexibilité pour modifier la croissance des revenus, le WACC, les marges et d'autres hypothèses cruciales pour s'aligner sur vos prévisions.
What You Will Receive
- Authentic 600055SS Financial Data: Pre-loaded with Beijing Wandong Medical Technology's historical and projected figures for accurate analysis.
- Completely Customizable Template: Easily adjust key inputs such as revenue growth, WACC, and EBITDA percentage.
- Instant Calculations: Watch as the intrinsic value of Beijing Wandong Medical updates immediately based on your modifications.
- Expert Valuation Tool: Tailored for investors, analysts, and consultants aiming for precise DCF outcomes.
- Intuitive Interface: A straightforward layout and clear guidance suitable for users of all experience levels.
Key Features
- 🔍 Real-Life [600055SS] Financials: Pre-filled historical and projected data for Beijing Wandong Medical Technology Co., Ltd.
- ✏️ Fully Customizable Inputs: Modify all essential parameters (yellow cells) such as WACC, growth %, and tax rates.
- 📊 Professional DCF Valuation: Integrated formulas compute the intrinsic value of Beijing Wandong using the Discounted Cash Flow approach.
- ⚡ Instant Results: Immediately visualize Beijing Wandong’s valuation after making adjustments.
- Scenario Analysis: Evaluate and compare outcomes for different financial assumptions side-by-side.
How It Works
- Step 1: Download the Excel file.
- Step 2: Review the pre-filled data for Beijing Wandong Medical Technology Co., Ltd. (600055SS), including historical and projected figures.
- Step 3: Modify key assumptions (highlighted in yellow) according to your analysis.
- Step 4: Observe the automatic recalculations for the intrinsic value of Beijing Wandong Medical Technology Co., Ltd. (600055SS).
- Step 5: Utilize the results for investment decisions or reporting purposes.
Why Opt for This Calculator?
- User-Friendly Interface: Perfect for both novices and seasoned professionals.
- Customizable Inputs: Adjust parameters effortlessly to suit your analysis.
- Real-Time Valuation: Instantly see how changes affect the valuation of Beijing Wandong Medical Technology Co., Ltd. (600055SS).
- Preconfigured Data: Comes with Beijing Wandong's actual financial metrics for quick and efficient analysis.
- Preferred by Experts: Widely utilized by investors and analysts for well-informed decision-making.
Who Can Benefit from This Product?
- Medical Students: Understand healthcare technology and its applications in real-world scenarios.
- Researchers: Integrate cutting-edge medical models into your academic projects or publications.
- Healthcare Investors: Evaluate your investment strategies and analyze the performance of Beijing Wandong Medical Technology Co., Ltd. (600055SS).
- Data Analysts: Enhance your efficiency with a customizable financial model tailored for the medical sector.
- Healthcare Entrepreneurs: Discover insights into how leading companies like Beijing Wandong Medical Technology Co., Ltd. (600055SS) operate and thrive.
What the Template Includes
- Comprehensive DCF Model: Editable template featuring in-depth valuation calculations.
- Real-World Data: Beijing Wandong Medical Technology Co., Ltd.’s (600055SS) historical and projected financials preloaded for analysis.
- Customizable Parameters: Modify WACC, growth rates, and tax assumptions to explore various scenarios.
- Financial Statements: Detailed annual and quarterly breakdowns for enhanced insights.
- Key Ratios: Integrated analysis for profitability, efficiency, and leverage metrics.
- Dashboard with Visual Outputs: Graphs and tables for clear, actionable insights.
Disclaimer
All information, articles, and product details provided on this website are for general informational and educational purposes only. We do not claim any ownership over, nor do we intend to infringe upon, any trademarks, copyrights, logos, brand names, or other intellectual property mentioned or depicted on this site. Such intellectual property remains the property of its respective owners, and any references here are made solely for identification or informational purposes, without implying any affiliation, endorsement, or partnership.
We make no representations or warranties, express or implied, regarding the accuracy, completeness, or suitability of any content or products presented. Nothing on this website should be construed as legal, tax, investment, financial, medical, or other professional advice. In addition, no part of this site—including articles or product references—constitutes a solicitation, recommendation, endorsement, advertisement, or offer to buy or sell any securities, franchises, or other financial instruments, particularly in jurisdictions where such activity would be unlawful.
All content is of a general nature and may not address the specific circumstances of any individual or entity. It is not a substitute for professional advice or services. Any actions you take based on the information provided here are strictly at your own risk. You accept full responsibility for any decisions or outcomes arising from your use of this website and agree to release us from any liability in connection with your use of, or reliance upon, the content or products found herein.