
|
Xinjiang Tianye Co., Ltd. (600075.SS) Évaluation DCF |
Entièrement Modifiable: Adapté À Vos Besoins Dans Excel Ou Sheets
Conception Professionnelle: Modèles Fiables Et Conformes Aux Normes Du Secteur
Pré-Construits Pour Une Utilisation Rapide Et Efficace
Compatible MAC/PC, entièrement débloqué
Aucune Expertise N'Est Requise; Facile À Suivre
Xinjiang Tianye Co.,Ltd. (600075.SS) Bundle
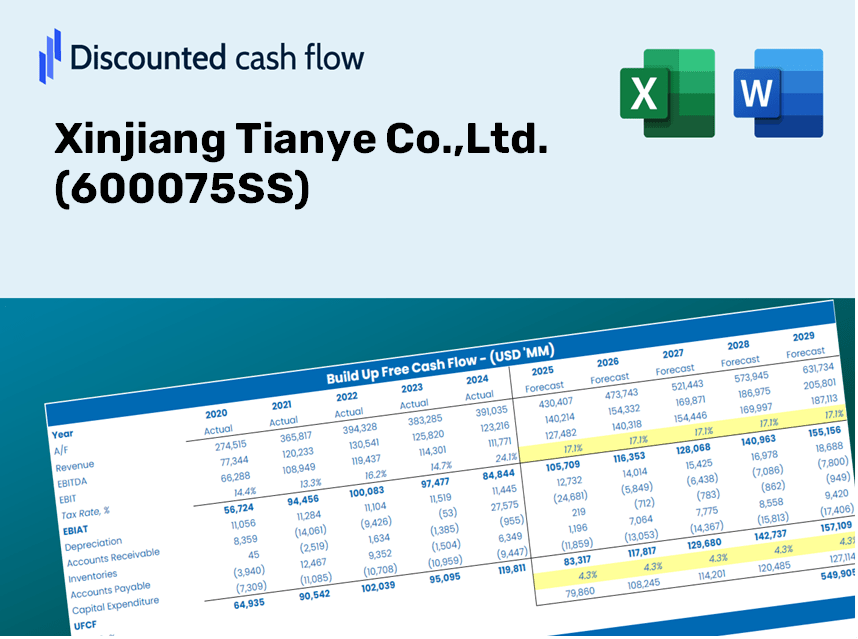
Découvrez le véritable potentiel de Xinjiang Tianye Co., Ltd. (600075SS) avec notre calculatrice avancée DCF! Ajustez les hypothèses critiques, explorez divers scénarios et évaluez comment les modifications influencent l'évaluation de Xinjiang Tianye Co., Ltd. (600075SS) - le tout dans un modèle Excel pratique.
Discounted Cash Flow (DCF) - (USD MM)
| Year | AY1 2020 |
AY2 2021 |
AY3 2022 |
AY4 2023 |
AY5 2024 |
FY1 2025 |
FY2 2026 |
FY3 2027 |
FY4 2028 |
FY5 2029 |
|---|---|---|---|---|---|---|---|---|---|---|
| Revenue | 9,335.2 | 12,014.6 | 14,262.4 | 11,465.0 | 11,155.9 | 11,115.3 | 11,074.9 | 11,034.6 | 10,994.4 | 10,954.4 |
| Revenue Growth, % | 0 | 28.7 | 18.71 | -19.61 | -2.7 | -0.36399 | -0.36399 | -0.36399 | -0.36399 | -0.36399 |
| EBITDA | 1,855.8 | 2,635.3 | 2,107.2 | 338.4 | 1,066.1 | 1,536.1 | 1,530.5 | 1,524.9 | 1,519.3 | 1,513.8 |
| EBITDA, % | 19.88 | 21.93 | 14.77 | 2.95 | 9.56 | 13.82 | 13.82 | 13.82 | 13.82 | 13.82 |
| Depreciation | 561.0 | 543.6 | 775.3 | 773.6 | 821.9 | 668.8 | 666.4 | 664.0 | 661.5 | 659.1 |
| Depreciation, % | 6.01 | 4.52 | 5.44 | 6.75 | 7.37 | 6.02 | 6.02 | 6.02 | 6.02 | 6.02 |
| EBIT | 1,294.8 | 2,091.7 | 1,331.8 | -435.3 | 244.2 | 867.2 | 864.1 | 860.9 | 857.8 | 854.7 |
| EBIT, % | 13.87 | 17.41 | 9.34 | -3.8 | 2.19 | 7.8 | 7.8 | 7.8 | 7.8 | 7.8 |
| Total Cash | 695.9 | 1,623.9 | 4,832.1 | 3,067.1 | 1,880.7 | 2,188.8 | 2,180.9 | 2,172.9 | 2,165.0 | 2,157.1 |
| Total Cash, percent | .0 | .0 | .0 | .0 | .0 | .0 | .0 | .0 | .0 | .0 |
| Account Receivables | 2,121.3 | 1,916.8 | 1,825.2 | 650.9 | 430.8 | 1,356.4 | 1,351.5 | 1,346.5 | 1,341.6 | 1,336.8 |
| Account Receivables, % | 22.72 | 15.95 | 12.8 | 5.68 | 3.86 | 12.2 | 12.2 | 12.2 | 12.2 | 12.2 |
| Inventories | 805.7 | 951.8 | 1,093.1 | 812.3 | 830.5 | 861.4 | 858.2 | 855.1 | 852.0 | 848.9 |
| Inventories, % | 8.63 | 7.92 | 7.66 | 7.09 | 7.44 | 7.75 | 7.75 | 7.75 | 7.75 | 7.75 |
| Accounts Payable | 966.3 | 1,927.2 | 2,361.6 | 2,636.5 | 2,964.0 | 2,056.7 | 2,049.2 | 2,041.7 | 2,034.3 | 2,026.9 |
| Accounts Payable, % | 10.35 | 16.04 | 16.56 | 23 | 26.57 | 18.5 | 18.5 | 18.5 | 18.5 | 18.5 |
| Capital Expenditure | -396.0 | -477.1 | -347.3 | -2,002.9 | -1,033.4 | -831.0 | -828.0 | -825.0 | -822.0 | -819.0 |
| Capital Expenditure, % | -4.24 | -3.97 | -2.44 | -17.47 | -9.26 | -7.48 | -7.48 | -7.48 | -7.48 | -7.48 |
| Tax Rate, % | 55.8 | 55.8 | 55.8 | 55.8 | 55.8 | 55.8 | 55.8 | 55.8 | 55.8 | 55.8 |
| EBITAT | 1,071.9 | 1,804.6 | 1,127.6 | -412.0 | 107.9 | 680.9 | 678.4 | 676.0 | 673.5 | 671.1 |
| Depreciation | ||||||||||
| Changes in Account Receivables | ||||||||||
| Changes in Inventories | ||||||||||
| Changes in Accounts Payable | ||||||||||
| Capital Expenditure | ||||||||||
| UFCF | -723.8 | 2,890.4 | 1,940.2 | 88.7 | 426.0 | -1,345.2 | 517.4 | 515.5 | 513.7 | 511.8 |
| WACC, % | 4.86 | 4.93 | 4.9 | 5.09 | 4.1 | 4.77 | 4.77 | 4.77 | 4.77 | 4.77 |
| PV UFCF | ||||||||||
| SUM PV UFCF | 467.3 | |||||||||
| Long Term Growth Rate, % | 1.00 | |||||||||
| Free cash flow (T + 1) | 517 | |||||||||
| Terminal Value | 13,695 | |||||||||
| Present Terminal Value | 10,847 | |||||||||
| Enterprise Value | 11,314 | |||||||||
| Net Debt | 3,947 | |||||||||
| Equity Value | 7,367 | |||||||||
| Diluted Shares Outstanding, MM | 1,711 | |||||||||
| Equity Value Per Share | 4.31 |
What You Will Receive
- Customizable Excel Template: A fully adjustable Excel-based DCF Calculator featuring pre-populated financials for Xinjiang Tianye Co., Ltd. (600075SS).
- Authentic Data: Historical performance metrics and future projections (highlighted in the yellow cells).
- Flexible Forecasting: Adjust forecasting parameters such as revenue growth, EBITDA margin, and WACC.
- Instant Calculations: Quickly observe how your input variables affect the valuation of Xinjiang Tianye Co., Ltd. (600075SS).
- Professional Resource: Designed for investors, CFOs, consultants, and financial analysts.
- Intuitive Layout: Organized for ease of understanding and usability, accompanied by clear step-by-step guidance.
Key Features
- Customizable Forecast Inputs: Adjust essential parameters such as revenue growth, EBITDA margins, and capital investments.
- Instant DCF Valuation: Automatically computes intrinsic value, NPV, and other relevant metrics in real-time.
- High Precision Accuracy: Incorporates Xinjiang Tianye Co., Ltd.'s financial data for credible valuation results.
- Simplified Scenario Analysis: Effortlessly evaluate various assumptions and analyze different outcomes.
- Efficiency Booster: Save time by removing the need to develop intricate valuation models from the ground up.
How It Functions
- Download: Obtain the pre-prepared Excel file featuring Xinjiang Tianye Co., Ltd.'s (600075SS) financial metrics.
- Customize: Tailor your forecasts, such as revenue growth, EBITDA %, and WACC values.
- Real-Time Updates: The intrinsic value and NPV calculations refresh instantly.
- Scenario Testing: Develop various projections and swiftly compare the results.
- Make Informed Decisions: Leverage the valuation insights to inform your investment approach.
Why Choose This Calculator for Xinjiang Tianye Co., Ltd. (600075SS)?
- Designed for Industry Experts: A sophisticated tool utilized by financial analysts, CFOs, and industry consultants.
- Actual Financial Data: Xinjiang Tianye Co., Ltd.'s historical and projected financial figures are preloaded for enhanced accuracy.
- Versatile Scenario Testing: Effortlessly model various forecasts and assumptions to explore different outcomes.
- Comprehensive Outputs: Automatically computes intrinsic value, NPV, and essential financial metrics.
- User-Friendly Interface: Step-by-step guidance simplifies the entire calculation process.
Who Can Benefit from This Product?
- Institutional Investors: Develop comprehensive and accurate valuation models for portfolio assessment of Xinjiang Tianye Co.,Ltd. (600075SS).
- Corporate Finance Departments: Evaluate valuation scenarios to inform strategic decisions within the company.
- Consultants and Financial Advisors: Deliver precise valuation analyses for clients interested in investing in Xinjiang Tianye Co.,Ltd. (600075SS).
- Students and Educators: Utilize real-time data to enhance learning and practice in financial modeling.
- Industry Analysts: Gain insights into how companies like Xinjiang Tianye Co.,Ltd. (600075SS) are valued in their respective markets.
Contents of the Template
- Pre-Filled Data: Features historical financials and projections for Xinjiang Tianye Co.,Ltd. (600075SS).
- Discounted Cash Flow Model: An editable DCF valuation model with automated calculations.
- Weighted Average Cost of Capital (WACC): A specific sheet for WACC calculations based on user-defined inputs.
- Key Financial Ratios: Assess Xinjiang Tianye Co.,Ltd.’s (600075SS) profitability, efficiency, and leverage metrics.
- Customizable Inputs: Easily modify revenue growth, profit margins, and tax rates.
- User-Friendly Dashboard: Visual charts and tables that highlight essential valuation outcomes.
Disclaimer
All information, articles, and product details provided on this website are for general informational and educational purposes only. We do not claim any ownership over, nor do we intend to infringe upon, any trademarks, copyrights, logos, brand names, or other intellectual property mentioned or depicted on this site. Such intellectual property remains the property of its respective owners, and any references here are made solely for identification or informational purposes, without implying any affiliation, endorsement, or partnership.
We make no representations or warranties, express or implied, regarding the accuracy, completeness, or suitability of any content or products presented. Nothing on this website should be construed as legal, tax, investment, financial, medical, or other professional advice. In addition, no part of this site—including articles or product references—constitutes a solicitation, recommendation, endorsement, advertisement, or offer to buy or sell any securities, franchises, or other financial instruments, particularly in jurisdictions where such activity would be unlawful.
All content is of a general nature and may not address the specific circumstances of any individual or entity. It is not a substitute for professional advice or services. Any actions you take based on the information provided here are strictly at your own risk. You accept full responsibility for any decisions or outcomes arising from your use of this website and agree to release us from any liability in connection with your use of, or reliance upon, the content or products found herein.