
|
SAIC Motor Corporation Limited (600104.SS) Évaluation DCF |
Entièrement Modifiable: Adapté À Vos Besoins Dans Excel Ou Sheets
Conception Professionnelle: Modèles Fiables Et Conformes Aux Normes Du Secteur
Pré-Construits Pour Une Utilisation Rapide Et Efficace
Compatible MAC/PC, entièrement débloqué
Aucune Expertise N'Est Requise; Facile À Suivre
SAIC Motor Corporation Limited (600104.SS) Bundle
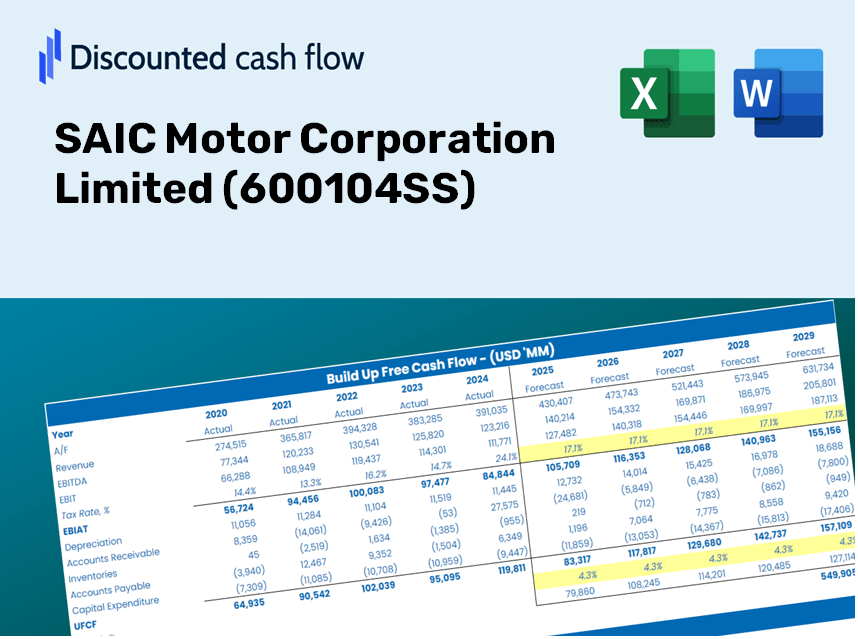
Gardez un aperçu de votre analyse d'évaluation de votre Saic Motor Corporation (600104SS) à l'aide de notre calculatrice sophistiquée DCF! Ce modèle Excel est préchargé avec des données réelles (600104SS), vous permettant d'ajuster les prévisions et les hypothèses pour un calcul précis de la valeur intrinsèque de SAIC Motor Corporation Limited.
Discounted Cash Flow (DCF) - (USD MM)
| Year | AY1 2020 |
AY2 2021 |
AY3 2022 |
AY4 2023 |
AY5 2024 |
FY1 2025 |
FY2 2026 |
FY3 2027 |
FY4 2028 |
FY5 2029 |
|---|---|---|---|---|---|---|---|---|---|---|
| Revenue | 742,132.5 | 779,845.8 | 744,062.9 | 744,705.1 | 627,589.9 | 603,825.0 | 580,960.0 | 558,960.9 | 537,794.7 | 517,430.1 |
| Revenue Growth, % | 0 | 5.08 | -4.59 | 0.08631663 | -15.73 | -3.79 | -3.79 | -3.79 | -3.79 | -3.79 |
| EBITDA | 33,482.8 | 24,289.3 | 21,279.3 | 24,566.7 | 23,321.7 | 21,135.2 | 20,334.9 | 19,564.9 | 18,824.0 | 18,111.2 |
| EBITDA, % | 4.51 | 3.11 | 2.86 | 3.3 | 3.72 | 3.5 | 3.5 | 3.5 | 3.5 | 3.5 |
| Depreciation | 13,651.8 | 15,544.5 | 15,337.2 | 16,828.6 | 17,248.6 | 13,166.1 | 12,667.5 | 12,187.8 | 11,726.3 | 11,282.3 |
| Depreciation, % | 1.84 | 1.99 | 2.06 | 2.26 | 2.75 | 2.18 | 2.18 | 2.18 | 2.18 | 2.18 |
| EBIT | 19,831.0 | 8,744.8 | 5,942.2 | 7,738.1 | 6,073.1 | 7,969.1 | 7,667.4 | 7,377.0 | 7,097.7 | 6,828.9 |
| EBIT, % | 2.67 | 1.12 | 0.79861 | 1.04 | 0.96768 | 1.32 | 1.32 | 1.32 | 1.32 | 1.32 |
| Total Cash | 197,365.8 | 192,409.4 | 200,386.7 | 190,323.6 | 260,256.3 | 175,380.6 | 168,739.4 | 162,349.8 | 156,202.1 | 150,287.2 |
| Total Cash, percent | .0 | .0 | .0 | .0 | .0 | .0 | .0 | .0 | .0 | .0 |
| Account Receivables | 80,728.6 | 63,955.5 | 81,154.7 | 117,154.0 | 112,403.6 | 76,840.2 | 73,930.5 | 71,131.0 | 68,437.5 | 65,846.0 |
| Account Receivables, % | 10.88 | 8.2 | 10.91 | 15.73 | 17.91 | 12.73 | 12.73 | 12.73 | 12.73 | 12.73 |
| Inventories | 69,395.5 | 56,635.9 | 88,535.0 | 98,603.7 | 77,277.2 | 65,292.9 | 62,820.5 | 60,441.7 | 58,152.9 | 55,950.9 |
| Inventories, % | 9.35 | 7.26 | 11.9 | 13.24 | 12.31 | 10.81 | 10.81 | 10.81 | 10.81 | 10.81 |
| Accounts Payable | 205,047.2 | 199,052.3 | 244,281.1 | 178,672.6 | 241,143.9 | 179,216.4 | 172,430.0 | 165,900.6 | 159,618.5 | 153,574.2 |
| Accounts Payable, % | 27.63 | 25.52 | 32.83 | 23.99 | 38.42 | 29.68 | 29.68 | 29.68 | 29.68 | 29.68 |
| Capital Expenditure | -15,137.8 | -18,742.7 | -22,934.7 | -19,409.9 | -20,802.3 | -16,238.7 | -15,623.8 | -15,032.2 | -14,463.0 | -13,915.3 |
| Capital Expenditure, % | -2.04 | -2.4 | -3.08 | -2.61 | -3.31 | -2.69 | -2.69 | -2.69 | -2.69 | -2.69 |
| Tax Rate, % | 84.15 | 84.15 | 84.15 | 84.15 | 84.15 | 84.15 | 84.15 | 84.15 | 84.15 | 84.15 |
| EBITAT | 11,288.6 | 5,162.4 | 3,411.8 | 4,202.6 | 962.8 | 3,881.6 | 3,734.6 | 3,593.2 | 3,457.1 | 3,326.2 |
| Depreciation | ||||||||||
| Changes in Account Receivables | ||||||||||
| Changes in Inventories | ||||||||||
| Changes in Accounts Payable | ||||||||||
| Capital Expenditure | ||||||||||
| UFCF | 64,725.7 | 25,501.9 | -8,055.3 | -110,055.2 | 85,957.3 | -13,570.8 | -625.9 | -602.2 | -579.4 | -557.5 |
| WACC, % | 4.18 | 4.22 | 4.19 | 4.14 | 3.53 | 4.05 | 4.05 | 4.05 | 4.05 | 4.05 |
| PV UFCF | ||||||||||
| SUM PV UFCF | -15,106.5 | |||||||||
| Long Term Growth Rate, % | 2.00 | |||||||||
| Free cash flow (T + 1) | -569 | |||||||||
| Terminal Value | -27,720 | |||||||||
| Present Terminal Value | -22,728 | |||||||||
| Enterprise Value | -37,834 | |||||||||
| Net Debt | -65,635 | |||||||||
| Equity Value | 27,800 | |||||||||
| Diluted Shares Outstanding, MM | 11,404 | |||||||||
| Equity Value Per Share | 2.44 |
What You Will Receive
- Adjustable Forecast Inputs: Easily modify assumptions (growth %, margins, WACC) to explore various scenarios.
- Comprehensive Historical Data: SAIC Motor Corporation Limited’s financial data pre-loaded to facilitate your analysis.
- Automated DCF Calculations: The template computes Net Present Value (NPV) and intrinsic value for you.
- Customizable and Professional Design: A refined Excel model that caters to your valuation requirements.
- Designed for Analysts and Investors: Perfect for evaluating projections, confirming strategies, and enhancing efficiency.
Key Features
- Comprehensive SAIC Data: Pre-loaded with SAIC Motor Corporation Limited’s historical financial performance and future projections.
- Tailorable Inputs: Modify variables such as revenue growth, profit margins, discount rates, tax obligations, and capital spending.
- Interactive Valuation Framework: Automatically refreshes Net Present Value (NPV) and intrinsic value based on your selected parameters.
- Scenario Analysis: Generate various forecasting scenarios to evaluate different valuation possibilities.
- Intuitive Interface: Designed for ease of use, suitable for both industry experts and newcomers.
How It Functions
- 1. Access the Template: Download and open the Excel file containing SAIC Motor Corporation Limited’s (600104SS) preloaded data.
- 2. Modify Assumptions: Adjust key inputs such as growth rates, WACC, and capital expenditures as needed.
- 3. Instantly View Results: The DCF model automatically calculates intrinsic value and NPV for your analysis.
- 4. Explore Different Scenarios: Evaluate various forecasts to understand different valuation results.
- 5. Present with Assurance: Share professional valuation insights to inform your strategic decisions.
Why Opt for This Calculator?
- User-Friendly Interface: Crafted to accommodate both novices and seasoned professionals.
- Customizable Inputs: Effortlessly adjust variables to suit your analytical needs.
- Real-Time Feedback: Observe immediate updates to SAIC Motor Corporation Limited’s (600104SS) valuation as you modify inputs.
- Pre-Loaded Data: Comes equipped with SAIC’s actual financial figures for swift assessments.
- Relied Upon by Experts: A preferred tool for investors and analysts to make well-informed choices.
Who Can Benefit from This Product?
- Investors: Evaluate SAIC Motor Corporation Limited's (600104SS) valuation before making trading decisions.
- CFOs and Financial Analysts: Optimize valuation methodologies and assess financial projections.
- Startup Founders: Discover how large public companies such as SAIC Motor Corporation Limited (600104SS) are valued.
- Consultants: Provide comprehensive valuation reports to clients utilizing insights from SAIC Motor Corporation Limited (600104SS).
- Students and Educators: Utilize real-time data from SAIC Motor Corporation Limited (600104SS) to learn and teach valuation strategies.
Contents of the Template
- Pre-Filled Data: Features SAIC Motor Corporation's historical financial figures and projections.
- Discounted Cash Flow Model: An editable DCF valuation model equipped with automatic calculations.
- Weighted Average Cost of Capital (WACC): A designated sheet for computing WACC using tailored inputs.
- Key Financial Ratios: Evaluate SAIC Motor’s profitability, operational efficiency, and financial leverage.
- Customizable Inputs: Easily adjust revenue growth, profit margins, and tax rates.
- Clear Dashboard: Visuals and tables that summarize essential valuation outcomes.
Disclaimer
All information, articles, and product details provided on this website are for general informational and educational purposes only. We do not claim any ownership over, nor do we intend to infringe upon, any trademarks, copyrights, logos, brand names, or other intellectual property mentioned or depicted on this site. Such intellectual property remains the property of its respective owners, and any references here are made solely for identification or informational purposes, without implying any affiliation, endorsement, or partnership.
We make no representations or warranties, express or implied, regarding the accuracy, completeness, or suitability of any content or products presented. Nothing on this website should be construed as legal, tax, investment, financial, medical, or other professional advice. In addition, no part of this site—including articles or product references—constitutes a solicitation, recommendation, endorsement, advertisement, or offer to buy or sell any securities, franchises, or other financial instruments, particularly in jurisdictions where such activity would be unlawful.
All content is of a general nature and may not address the specific circumstances of any individual or entity. It is not a substitute for professional advice or services. Any actions you take based on the information provided here are strictly at your own risk. You accept full responsibility for any decisions or outcomes arising from your use of this website and agree to release us from any liability in connection with your use of, or reliance upon, the content or products found herein.