
|
Zhejiang Orient Financial Holdings Group Co., Ltd. (600120.SS) Évaluation DCF |
Entièrement Modifiable: Adapté À Vos Besoins Dans Excel Ou Sheets
Conception Professionnelle: Modèles Fiables Et Conformes Aux Normes Du Secteur
Pré-Construits Pour Une Utilisation Rapide Et Efficace
Compatible MAC/PC, entièrement débloqué
Aucune Expertise N'Est Requise; Facile À Suivre
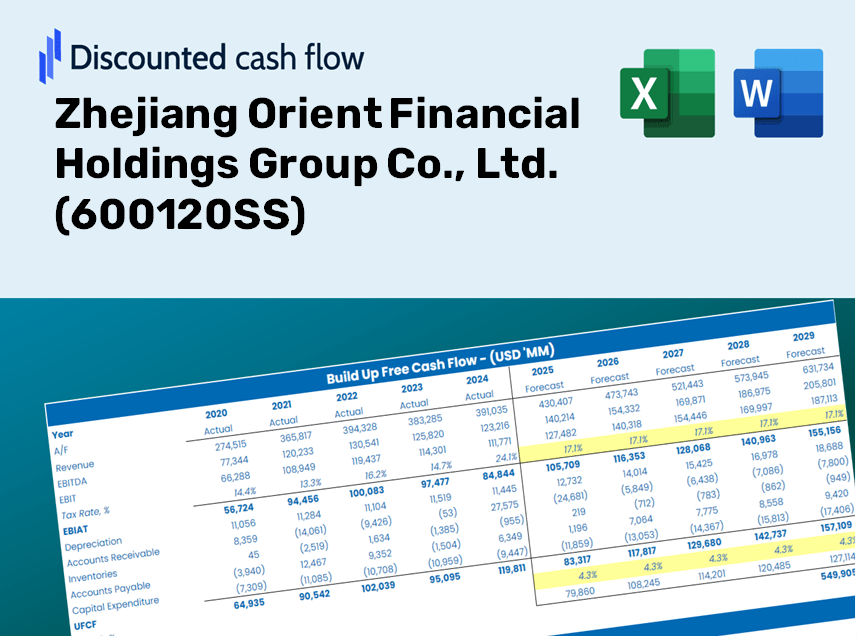
Zhejiang Orient Financial Holdings Group Co., Ltd. (600120.SS) Bundle
Rationalisez votre analyse et améliorez la précision avec notre calculatrice DCF (600120SS)! Équipée de données réelles de Zhejiang Orient Financial Holdings Group Co., Ltd. et des hypothèses personnalisables, cet outil vous permet de prévoir, d'analyser et d'évaluer (600120SS) comme un investisseur chevronné.
Discounted Cash Flow (DCF) - (USD MM)
| Year | AY1 2020 |
AY2 2021 |
AY3 2022 |
AY4 2023 |
AY5 2024 |
FY1 2025 |
FY2 2026 |
FY3 2027 |
FY4 2028 |
FY5 2029 |
|---|---|---|---|---|---|---|---|---|---|---|
| Revenue | 15,858.7 | 17,669.8 | 19,884.1 | 16,211.5 | 8,195.9 | 7,295.2 | 6,493.4 | 5,779.7 | 5,144.5 | 4,579.1 |
| Revenue Growth, % | 0 | 11.42 | 12.53 | -18.47 | -49.44 | -10.99 | -10.99 | -10.99 | -10.99 | -10.99 |
| EBITDA | 558.6 | 659.1 | 440.3 | 2.1 | -257.9 | 92.4 | 82.2 | 73.2 | 65.2 | 58.0 |
| EBITDA, % | 3.52 | 3.73 | 2.21 | 0.01288849 | -3.15 | 1.27 | 1.27 | 1.27 | 1.27 | 1.27 |
| Depreciation | 55.0 | 66.2 | 92.8 | 138.4 | 140.7 | 54.8 | 48.8 | 43.4 | 38.7 | 34.4 |
| Depreciation, % | 0.34652 | 0.37447 | 0.46653 | 0.85345 | 1.72 | 0.75162 | 0.75162 | 0.75162 | 0.75162 | 0.75162 |
| EBIT | 503.6 | 593.0 | 347.5 | -136.3 | -398.6 | 37.6 | 33.4 | 29.8 | 26.5 | 23.6 |
| EBIT, % | 3.18 | 3.36 | 1.75 | -0.84056 | -4.86 | 0.51495 | 0.51495 | 0.51495 | 0.51495 | 0.51495 |
| Total Cash | 6,301.1 | 9,211.8 | 13,009.9 | 11,563.0 | 12,685.9 | 4,794.7 | 4,267.7 | 3,798.7 | 3,381.2 | 3,009.6 |
| Total Cash, percent | .0 | .0 | .0 | .0 | .0 | .0 | .0 | .0 | .0 | .0 |
| Account Receivables | 258.1 | 3,298.0 | 1,316.4 | 904.0 | 1,416.8 | 726.3 | 646.4 | 575.4 | 512.1 | 455.9 |
| Account Receivables, % | 1.63 | 18.66 | 6.62 | 5.58 | 17.29 | 9.96 | 9.96 | 9.96 | 9.96 | 9.96 |
| Inventories | 991.4 | 444.5 | 613.0 | 620.1 | 1,149.3 | 433.3 | 385.7 | 343.3 | 305.6 | 272.0 |
| Inventories, % | 6.25 | 2.52 | 3.08 | 3.82 | 14.02 | 5.94 | 5.94 | 5.94 | 5.94 | 5.94 |
| Accounts Payable | 653.2 | 537.4 | 584.0 | 197.9 | 1,255.8 | 388.7 | 346.0 | 307.9 | 274.1 | 244.0 |
| Accounts Payable, % | 4.12 | 3.04 | 2.94 | 1.22 | 15.32 | 5.33 | 5.33 | 5.33 | 5.33 | 5.33 |
| Capital Expenditure | -97.4 | -49.1 | -76.9 | -74.1 | -65.5 | -37.0 | -32.9 | -29.3 | -26.1 | -23.2 |
| Capital Expenditure, % | -0.61414 | -0.27812 | -0.38688 | -0.45718 | -0.79941 | -0.50715 | -0.50715 | -0.50715 | -0.50715 | -0.50715 |
| Tax Rate, % | -3.4 | -3.4 | -3.4 | -3.4 | -3.4 | -3.4 | -3.4 | -3.4 | -3.4 | -3.4 |
| EBITAT | 373.8 | 448.3 | 323.3 | -126.8 | -412.2 | 32.8 | 29.2 | 25.9 | 23.1 | 20.6 |
| Depreciation | ||||||||||
| Changes in Account Receivables | ||||||||||
| Changes in Inventories | ||||||||||
| Changes in Accounts Payable | ||||||||||
| Capital Expenditure | ||||||||||
| UFCF | -264.9 | -2,143.6 | 2,198.8 | -43.4 | -321.2 | 590.1 | 129.8 | 115.5 | 102.8 | 91.5 |
| WACC, % | 4.65 | 4.67 | 4.84 | 4.84 | 4.91 | 4.78 | 4.78 | 4.78 | 4.78 | 4.78 |
| PV UFCF | ||||||||||
| SUM PV UFCF | 939.5 | |||||||||
| Long Term Growth Rate, % | 2.00 | |||||||||
| Free cash flow (T + 1) | 93 | |||||||||
| Terminal Value | 3,356 | |||||||||
| Present Terminal Value | 2,657 | |||||||||
| Enterprise Value | 3,597 | |||||||||
| Net Debt | 1,420 | |||||||||
| Equity Value | 2,177 | |||||||||
| Diluted Shares Outstanding, MM | 3,344 | |||||||||
| Equity Value Per Share | 0.65 |
Benefits You Will Receive
- Adjustable Forecast Variables: Modify assumptions (growth %, margins, WACC) with ease to explore various scenarios.
- Real Data from the Market: Pre-filled financial information for Zhejiang Orient Financial Holdings Group Co., Ltd. (600120SS) to kickstart your analysis.
- Automated DCF Calculations: The template computes Net Present Value (NPV) and intrinsic value automatically.
- Professional and Adaptable: A refined Excel model tailored to your valuation requirements.
- Designed for Analysts and Investors: Perfect for evaluating projections, confirming strategies, and enhancing efficiency.
Key Features
- Live Historical Data for [600120SS]: Pre-loaded with Zhejiang Orient Financial Holdings Group Co., Ltd.'s past financial performance and future forecasts.
- Completely Adjustable Parameters: Modify inputs such as revenue growth, profit margins, WACC, tax rates, and capital expenditures to suit your analysis.
- Adaptive Valuation Model: Automatic recalibration of Net Present Value (NPV) and intrinsic value based on your specified inputs.
- Scenario Analysis: Build various forecasting scenarios to evaluate different potential valuation results.
- Intuitive Interface: A straightforward and organized design catering to both industry professionals and newcomers.
How It Works
- Step 1: Download the prebuilt Excel template containing data for Zhejiang Orient Financial Holdings Group Co., Ltd. (600120SS).
- Step 2: Review the pre-filled sheets to familiarize yourself with the key metrics.
- Step 3: Modify forecasts and assumptions in the editable yellow cells (WACC, growth rates, margins).
- Step 4: Immediately see the recalculated results, which include the intrinsic value of Zhejiang Orient Financial Holdings Group Co., Ltd. (600120SS).
- Step 5: Utilize the outputs to make informed investment decisions or create comprehensive reports.
Why Select This Calculator?
- Precision: Utilizing actual financial data from Zhejiang Orient Financial Holdings Group Co., Ltd. ensures precise calculations.
- Adaptability: Built to allow users to easily modify and test various inputs.
- Efficiency: Eliminate the need to create a DCF model from the ground up.
- High-Quality: Crafted with the accuracy and functionality expected at the CFO level.
- Intuitive: Designed for ease of use, making it accessible for users without extensive financial modeling skills.
Who Should Use This Product?
- Investors: Accurately assess the fair value of Zhejiang Orient Financial Holdings Group Co., Ltd. (600120SS) before making investment choices.
- CFOs: Utilize a professional-grade DCF model for financial reporting and comprehensive analysis.
- Consultants: Easily customize the template for valuation reports tailored to clients.
- Entrepreneurs: Discover insights into financial modeling practices of leading companies.
- Educators: Employ it as a teaching resource to illustrate valuation techniques.
Contents of the Template
- Comprehensive DCF Model: An editable template featuring in-depth valuation calculations.
- Real-World Data: Historical and projected financial data for Zhejiang Orient Financial Holdings Group Co., Ltd. (600120SS) preloaded for analysis.
- Customizable Parameters: Modify WACC, growth rates, and tax assumptions to explore various scenarios.
- Financial Statements: Complete annual and quarterly breakdowns for extensive insights.
- Key Ratios: Integrated analysis for profitability, efficiency, and leverage.
- Dashboard with Visual Outputs: Visual aids like charts and tables for straightforward, actionable results.
Disclaimer
All information, articles, and product details provided on this website are for general informational and educational purposes only. We do not claim any ownership over, nor do we intend to infringe upon, any trademarks, copyrights, logos, brand names, or other intellectual property mentioned or depicted on this site. Such intellectual property remains the property of its respective owners, and any references here are made solely for identification or informational purposes, without implying any affiliation, endorsement, or partnership.
We make no representations or warranties, express or implied, regarding the accuracy, completeness, or suitability of any content or products presented. Nothing on this website should be construed as legal, tax, investment, financial, medical, or other professional advice. In addition, no part of this site—including articles or product references—constitutes a solicitation, recommendation, endorsement, advertisement, or offer to buy or sell any securities, franchises, or other financial instruments, particularly in jurisdictions where such activity would be unlawful.
All content is of a general nature and may not address the specific circumstances of any individual or entity. It is not a substitute for professional advice or services. Any actions you take based on the information provided here are strictly at your own risk. You accept full responsibility for any decisions or outcomes arising from your use of this website and agree to release us from any liability in connection with your use of, or reliance upon, the content or products found herein.