
|
Industrie du charbon de Zhengzhou & Electric Power Co., Ltd. (600121.SS) Évaluation DCF |
Entièrement Modifiable: Adapté À Vos Besoins Dans Excel Ou Sheets
Conception Professionnelle: Modèles Fiables Et Conformes Aux Normes Du Secteur
Pré-Construits Pour Une Utilisation Rapide Et Efficace
Compatible MAC/PC, entièrement débloqué
Aucune Expertise N'Est Requise; Facile À Suivre
Zhengzhou Coal Industry & Electric Power Co., Ltd. (600121.SS) Bundle
Explorez l'avenir financier de l'industrie du charbon de Zhengzhou & Electric Power Co., Ltd. (600121SS) avec notre calculatrice DCF conviviale! Entrez vos hypothèses concernant la croissance, les marges et les coûts pour déterminer la valeur intrinsèque de l'industrie du charbon de Zhengzhou & Electric Power Co., Ltd. (600121SS) et affinez votre stratégie d'investissement.
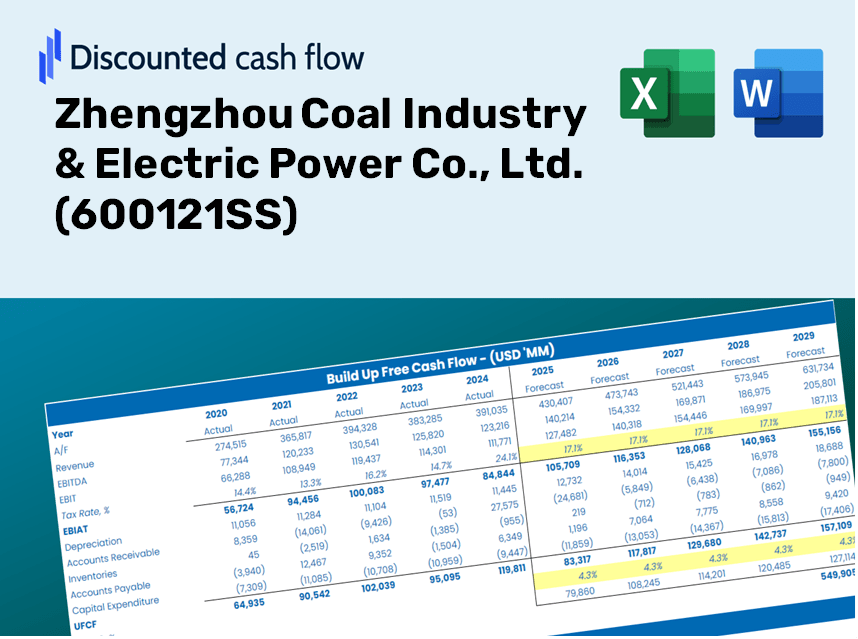
Discounted Cash Flow (DCF) - (USD MM)
| Year | AY1 2020 |
AY2 2021 |
AY3 2022 |
AY4 2023 |
AY5 2024 |
FY1 2025 |
FY2 2026 |
FY3 2027 |
FY4 2028 |
FY5 2029 |
|---|---|---|---|---|---|---|---|---|---|---|
| Revenue | 2,793.3 | 3,212.3 | 4,423.1 | 4,164.9 | 4,204.9 | 4,707.6 | 5,270.3 | 5,900.3 | 6,605.6 | 7,395.2 |
| Revenue Growth, % | 0 | 15 | 37.69 | -5.84 | 0.96138 | 11.95 | 11.95 | 11.95 | 11.95 | 11.95 |
| EBITDA | 158.0 | 761.3 | 1,121.3 | 1,012.7 | 1,191.9 | 1,010.9 | 1,131.7 | 1,267.0 | 1,418.4 | 1,588.0 |
| EBITDA, % | 5.66 | 23.7 | 25.35 | 24.31 | 28.35 | 21.47 | 21.47 | 21.47 | 21.47 | 21.47 |
| Depreciation | 371.6 | 385.4 | 425.5 | 458.9 | 509.2 | 546.5 | 611.8 | 685.0 | 766.8 | 858.5 |
| Depreciation, % | 13.3 | 12 | 9.62 | 11.02 | 12.11 | 11.61 | 11.61 | 11.61 | 11.61 | 11.61 |
| EBIT | -213.6 | 375.9 | 695.8 | 553.8 | 682.8 | 464.4 | 519.9 | 582.0 | 651.6 | 729.5 |
| EBIT, % | -7.65 | 11.7 | 15.73 | 13.3 | 16.24 | 9.86 | 9.86 | 9.86 | 9.86 | 9.86 |
| Total Cash | 3,808.5 | 3,072.3 | 3,816.2 | 2,741.4 | 3,058.9 | 3,959.0 | 4,432.2 | 4,962.0 | 5,555.2 | 6,219.2 |
| Total Cash, percent | .0 | .0 | .0 | .0 | .0 | .0 | .0 | .0 | .0 | .0 |
| Account Receivables | 1,584.1 | 1,573.0 | 1,217.8 | 1,261.0 | 1,163.8 | 1,799.8 | 2,015.0 | 2,255.8 | 2,525.5 | 2,827.4 |
| Account Receivables, % | 56.71 | 48.97 | 27.53 | 30.28 | 27.68 | 38.23 | 38.23 | 38.23 | 38.23 | 38.23 |
| Inventories | 290.2 | 236.6 | 167.1 | 121.7 | 84.9 | 249.3 | 279.1 | 312.4 | 349.8 | 391.6 |
| Inventories, % | 10.39 | 7.37 | 3.78 | 2.92 | 2.02 | 5.3 | 5.3 | 5.3 | 5.3 | 5.3 |
| Accounts Payable | 6,232.8 | 5,095.3 | 5,611.0 | 5,196.0 | 5,259.4 | 4,707.6 | 5,270.3 | 5,900.3 | 6,605.6 | 7,395.2 |
| Accounts Payable, % | 223.13 | 158.62 | 126.86 | 124.76 | 125.08 | 100 | 100 | 100 | 100 | 100 |
| Capital Expenditure | -7.3 | -64.4 | -99.2 | -391.5 | -548.5 | -253.8 | -284.1 | -318.1 | -356.1 | -398.7 |
| Capital Expenditure, % | -0.26258 | -2.01 | -2.24 | -9.4 | -13.04 | -5.39 | -5.39 | -5.39 | -5.39 | -5.39 |
| Tax Rate, % | 39.61 | 39.61 | 39.61 | 39.61 | 39.61 | 39.61 | 39.61 | 39.61 | 39.61 | 39.61 |
| EBITAT | -235.3 | -18.4 | 448.1 | 50.5 | 412.3 | 217.2 | 243.2 | 272.3 | 304.8 | 341.3 |
| Depreciation | ||||||||||
| Changes in Account Receivables | ||||||||||
| Changes in Inventories | ||||||||||
| Changes in Accounts Payable | ||||||||||
| Capital Expenditure | ||||||||||
| UFCF | 4,487.3 | -770.2 | 1,714.8 | -294.9 | 570.3 | -842.3 | 888.7 | 994.9 | 1,113.9 | 1,247.0 |
| WACC, % | 10.97 | 8.12 | 9.96 | 8.38 | 9.84 | 9.45 | 9.45 | 9.45 | 9.45 | 9.45 |
| PV UFCF | ||||||||||
| SUM PV UFCF | 2,300.9 | |||||||||
| Long Term Growth Rate, % | 2.00 | |||||||||
| Free cash flow (T + 1) | 1,272 | |||||||||
| Terminal Value | 17,064 | |||||||||
| Present Terminal Value | 10,862 | |||||||||
| Enterprise Value | 13,163 | |||||||||
| Net Debt | -449 | |||||||||
| Equity Value | 13,612 | |||||||||
| Diluted Shares Outstanding, MM | 1,218 | |||||||||
| Equity Value Per Share | 11.17 |
What You Will Receive
- Authentic 600121 Financials: Access to both historical and projected data for precise valuation.
- Customizable Inputs: Adjust parameters such as WACC, tax rates, revenue growth, and capital investments.
- Automated Calculations: Dynamic computation of intrinsic value and NPV.
- Scenario Analysis: Explore various scenarios to assess the future performance of Zhengzhou Coal Industry & Electric Power Co., Ltd.
- User-Friendly Design: Designed for professionals while remaining accessible to newcomers.
Key Features
- 🔍 Real-Life (600121SS) Financials: Pre-filled historical and projected data for Zhengzhou Coal Industry & Electric Power Co., Ltd.
- ✏️ Fully Customizable Inputs: Adjust all critical parameters (yellow cells) such as WACC, growth %, and tax rates.
- 📊 Professional DCF Valuation: Integrated formulas calculate the intrinsic value of Zhengzhou Coal using the Discounted Cash Flow method.
- ⚡ Instant Results: Visualize the valuation of Zhengzhou Coal immediately after making adjustments.
- Scenario Analysis: Analyze and compare outcomes for different financial assumptions side-by-side.
How It Works
- 1. Access the Template: Download and open the Excel file containing Zhengzhou Coal Industry & Electric Power Co., Ltd.'s (600121SS) preloaded data.
- 2. Adjust Key Inputs: Modify essential parameters such as growth rates, WACC, and capital expenditures.
- 3. See Instant Results: The DCF model automatically computes intrinsic value and NPV.
- 4. Explore Various Scenarios: Analyze different forecasts to evaluate alternative valuation results.
- 5. Make Informed Decisions: Share professional valuation insights to bolster your strategic choices.
Why Choose This Calculator for Zhengzhou Coal Industry & Electric Power Co., Ltd. (600121SS)?
- All-in-One Solution: Combines DCF, WACC, and financial ratio analyses for comprehensive evaluations.
- Flexible Customization: Modify the yellow-highlighted fields to explore different financial scenarios.
- In-Depth Analysis: Automatically determines the intrinsic value and Net Present Value for Zhengzhou Coal Industry & Electric Power Co., Ltd. (600121SS).
- Data-Ready: Comes with both historical and projected data for precise calculations.
- High Professional Standards: Perfectly suited for financial analysts, investors, and industry consultants.
Who Should Use This Product?
- Individual Investors: Gain insights for making informed decisions regarding investments in Zhengzhou Coal Industry & Electric Power Co., Ltd. (600121SS).
- Financial Analysts: Enhance valuation methods with pre-built financial models tailored for companies like Zhengzhou Coal Industry & Electric Power Co., Ltd. (600121SS).
- Consultants: Provide clients with swift and precise valuation analyses related to Zhengzhou Coal Industry & Electric Power Co., Ltd. (600121SS).
- Business Owners: Learn how major players like Zhengzhou Coal Industry & Electric Power Co., Ltd. (600121SS) are valued to inform your own business strategies.
- Finance Students: Acquire practical knowledge of valuation techniques by engaging with real-world data from Zhengzhou Coal Industry & Electric Power Co., Ltd. (600121SS).
Components of the Template
- Historical Data: Contains Zhengzhou Coal Industry & Electric Power Co., Ltd.’s past financial performance and foundational forecasts.
- DCF and Levered DCF Models: Comprehensive templates designed to assess the intrinsic value of Zhengzhou Coal Industry & Electric Power Co., Ltd. (600121SS).
- WACC Sheet: Pre-calculated metrics for the Weighted Average Cost of Capital.
- Editable Inputs: Adjust essential variables such as growth rates, EBITDA percentages, and CAPEX projections.
- Quarterly and Annual Statements: An in-depth analysis of the financials for Zhengzhou Coal Industry & Electric Power Co., Ltd. (600121SS).
- Interactive Dashboard: Dynamically visualize valuation outcomes and forecasts.
Disclaimer
All information, articles, and product details provided on this website are for general informational and educational purposes only. We do not claim any ownership over, nor do we intend to infringe upon, any trademarks, copyrights, logos, brand names, or other intellectual property mentioned or depicted on this site. Such intellectual property remains the property of its respective owners, and any references here are made solely for identification or informational purposes, without implying any affiliation, endorsement, or partnership.
We make no representations or warranties, express or implied, regarding the accuracy, completeness, or suitability of any content or products presented. Nothing on this website should be construed as legal, tax, investment, financial, medical, or other professional advice. In addition, no part of this site—including articles or product references—constitutes a solicitation, recommendation, endorsement, advertisement, or offer to buy or sell any securities, franchises, or other financial instruments, particularly in jurisdictions where such activity would be unlawful.
All content is of a general nature and may not address the specific circumstances of any individual or entity. It is not a substitute for professional advice or services. Any actions you take based on the information provided here are strictly at your own risk. You accept full responsibility for any decisions or outcomes arising from your use of this website and agree to release us from any liability in connection with your use of, or reliance upon, the content or products found herein.