
|
Shanxi Lanhua Sci-Tech Venture Co., Ltd (600123.SS) Évaluation DCF |
Entièrement Modifiable: Adapté À Vos Besoins Dans Excel Ou Sheets
Conception Professionnelle: Modèles Fiables Et Conformes Aux Normes Du Secteur
Pré-Construits Pour Une Utilisation Rapide Et Efficace
Compatible MAC/PC, entièrement débloqué
Aucune Expertise N'Est Requise; Facile À Suivre
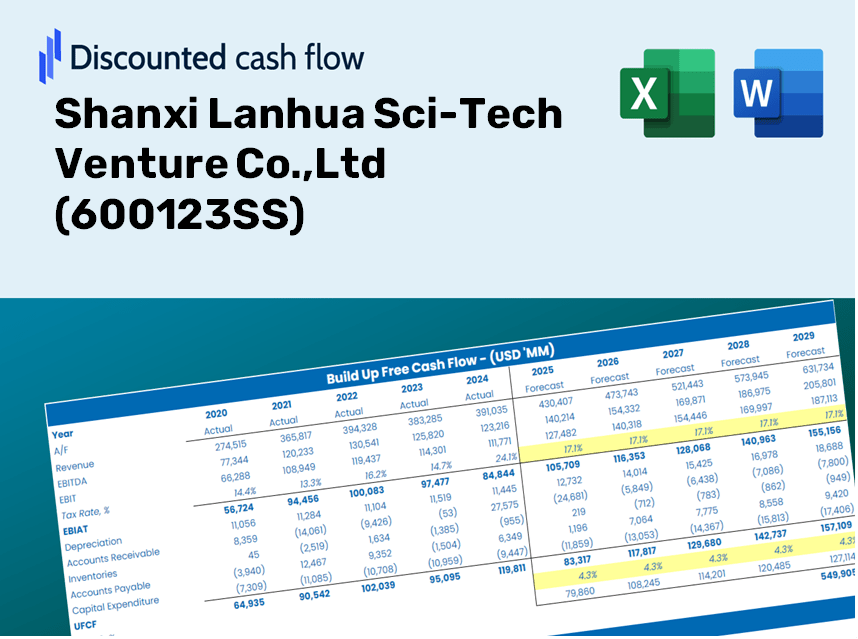
Shanxi Lanhua Sci-Tech Venture Co.,Ltd (600123.SS) Bundle
Vous cherchez à évaluer la valeur intrinsèque de Shanxi Lanhua Sci-Tech Venture Co., Ltd? Notre calculatrice DCF (600123SS) intègre des données réelles avec des fonctionnalités de personnalisation étendues, vous permettant d'affiner vos projections et de faire des choix d'investissement plus éclairés.
Discounted Cash Flow (DCF) - (USD MM)
| Year | AY1 2020 |
AY2 2021 |
AY3 2022 |
AY4 2023 |
AY5 2024 |
FY1 2025 |
FY2 2026 |
FY3 2027 |
FY4 2028 |
FY5 2029 |
|---|---|---|---|---|---|---|---|---|---|---|
| Revenue | 6,626.4 | 12,909.0 | 14,155.6 | 13,283.8 | 11,696.7 | 11,300.3 | 10,917.4 | 10,547.4 | 10,190.0 | 9,844.7 |
| Revenue Growth, % | 0 | 94.81 | 9.66 | -6.16 | -11.95 | -3.39 | -3.39 | -3.39 | -3.39 | -3.39 |
| EBITDA | 1,518.5 | 4,996.3 | 6,264.8 | 4,584.5 | 2,745.7 | 3,703.4 | 3,577.9 | 3,456.7 | 3,339.5 | 3,226.4 |
| EBITDA, % | 22.92 | 38.7 | 44.26 | 34.51 | 23.47 | 32.77 | 32.77 | 32.77 | 32.77 | 32.77 |
| Depreciation | 945.6 | 1,142.9 | 1,288.8 | 1,306.6 | 1,890.1 | 1,315.9 | 1,271.3 | 1,228.2 | 1,186.6 | 1,146.4 |
| Depreciation, % | 14.27 | 8.85 | 9.1 | 9.84 | 16.16 | 11.64 | 11.64 | 11.64 | 11.64 | 11.64 |
| EBIT | 572.9 | 3,853.4 | 4,976.0 | 3,277.9 | 855.6 | 2,387.5 | 2,306.6 | 2,228.4 | 2,152.9 | 2,080.0 |
| EBIT, % | 8.65 | 29.85 | 35.15 | 24.68 | 7.31 | 21.13 | 21.13 | 21.13 | 21.13 | 21.13 |
| Total Cash | 1,794.0 | 2,700.5 | 5,364.8 | 5,515.5 | 5,950.3 | 4,029.3 | 3,892.8 | 3,760.9 | 3,633.4 | 3,510.3 |
| Total Cash, percent | .0 | .0 | .0 | .0 | .0 | .0 | .0 | .0 | .0 | .0 |
| Account Receivables | 1,581.0 | 3,141.2 | 2,316.1 | 2,055.3 | 1,016.2 | 2,005.0 | 1,937.1 | 1,871.4 | 1,808.0 | 1,746.7 |
| Account Receivables, % | 23.86 | 24.33 | 16.36 | 15.47 | 8.69 | 17.74 | 17.74 | 17.74 | 17.74 | 17.74 |
| Inventories | 494.6 | 607.2 | 460.0 | 534.7 | 608.2 | 556.9 | 538.1 | 519.8 | 502.2 | 485.2 |
| Inventories, % | 7.46 | 4.7 | 3.25 | 4.03 | 5.2 | 4.93 | 4.93 | 4.93 | 4.93 | 4.93 |
| Accounts Payable | 2,462.2 | 2,687.9 | 2,828.5 | 1,450.8 | 3,646.2 | 2,713.3 | 2,621.4 | 2,532.6 | 2,446.7 | 2,363.8 |
| Accounts Payable, % | 37.16 | 20.82 | 19.98 | 10.92 | 31.17 | 24.01 | 24.01 | 24.01 | 24.01 | 24.01 |
| Capital Expenditure | -738.1 | -790.2 | -506.2 | -630.8 | -484.5 | -671.8 | -649.1 | -627.1 | -605.8 | -585.3 |
| Capital Expenditure, % | -11.14 | -6.12 | -3.58 | -4.75 | -4.14 | -5.95 | -5.95 | -5.95 | -5.95 | -5.95 |
| Tax Rate, % | 13.2 | 13.2 | 13.2 | 13.2 | 13.2 | 13.2 | 13.2 | 13.2 | 13.2 | 13.2 |
| EBITAT | 427.9 | 3,063.9 | 3,525.8 | 2,136.4 | 742.6 | 1,800.3 | 1,739.3 | 1,680.4 | 1,623.4 | 1,568.4 |
| Depreciation | ||||||||||
| Changes in Account Receivables | ||||||||||
| Changes in Inventories | ||||||||||
| Changes in Accounts Payable | ||||||||||
| Capital Expenditure | ||||||||||
| UFCF | 1,021.9 | 1,969.6 | 5,421.2 | 1,620.7 | 5,309.3 | 573.9 | 2,356.4 | 2,276.5 | 2,199.4 | 2,124.9 |
| WACC, % | 4.49 | 4.58 | 4.41 | 4.29 | 4.73 | 4.5 | 4.5 | 4.5 | 4.5 | 4.5 |
| PV UFCF | ||||||||||
| SUM PV UFCF | 8,251.5 | |||||||||
| Long Term Growth Rate, % | 0.50 | |||||||||
| Free cash flow (T + 1) | 2,135 | |||||||||
| Terminal Value | 53,391 | |||||||||
| Present Terminal Value | 42,844 | |||||||||
| Enterprise Value | 51,095 | |||||||||
| Net Debt | -630 | |||||||||
| Equity Value | 51,726 | |||||||||
| Diluted Shares Outstanding, MM | 1,482 | |||||||||
| Equity Value Per Share | 34.91 |
Benefits You Will Receive
- Pre-Filled Financial Model: Utilizes Shanxi Lanhua's actual data for accurate DCF valuation.
- Comprehensive Forecast Control: Modify revenue growth, profit margins, WACC, and other crucial variables.
- Real-Time Calculations: Automatic updates provide immediate results as you adjust inputs.
- Investor-Ready Template: A polished Excel document crafted for high-quality valuation presentations.
- Customizable and Reusable: Designed for versatility, enabling repeated use for in-depth financial forecasts.
Key Features
- Real-Time 600123SS Data: Pre-loaded with Shanxi Lanhua Sci-Tech Venture Co., Ltd's historical financials and future growth forecasts.
- Completely Customizable Inputs: Tailor revenue growth rates, profit margins, WACC, tax rates, and capital expenditures to fit your analysis.
- Interactive Valuation Model: Automatically refreshes Net Present Value (NPV) and intrinsic value based on your input adjustments.
- Multi-Scenario Analysis: Develop various forecast scenarios to explore different valuation possibilities.
- Intuitive Interface: Designed for ease of use, appealing to both professionals and newcomers alike.
How It Operates
- Download: Obtain the pre-built Excel file containing Shanxi Lanhua Sci-Tech Venture Co.,Ltd’s (600123SS) financial data.
- Customize: Tailor forecasts such as revenue growth, EBITDA %, and WACC to your preferences.
- Real-Time Updates: Intrinsic value and NPV calculations refresh automatically as data changes.
- Scenario Testing: Develop multiple projections and instantly compare the results.
- Informed Decisions: Utilize valuation findings to shape your investment strategies.
Why Opt for This Calculator?
- Designed for Experts: A specialized tool utilized by analysts, CFOs, and industry consultants.
- Accurate Data: Historical and projected financials for Shanxi Lanhua Sci-Tech Venture Co.,Ltd (600123SS) preloaded for precision.
- Flexible Scenario Analysis: Effortlessly explore various forecasts and assumptions.
- Comprehensive Outputs: Automatically generates intrinsic value, NPV, and essential metrics.
- User-Friendly: Step-by-step guidance makes the process straightforward.
Who Should Benefit from This Product?
- Investors: Evaluate the worth of Shanxi Lanhua Sci-Tech Venture Co., Ltd (600123SS) before making stock transactions.
- CFOs and Financial Analysts: Optimize valuation methods and assess financial forecasts.
- Startup Founders: Gain insights into the valuation practices of established companies like Shanxi Lanhua.
- Consultants: Provide detailed valuation reports to enhance client services.
- Students and Educators: Utilize real data for hands-on learning and teaching of valuation strategies.
What the Template Includes
- Pre-Filled DCF Model: Shanxi Lanhua Sci-Tech Venture Co., Ltd’s financial data preloaded for immediate use.
- WACC Calculator: Comprehensive calculations for Weighted Average Cost of Capital.
- Financial Ratios: Assess Shanxi Lanhua’s profitability, leverage, and operational efficiency.
- Editable Inputs: Adjust assumptions such as growth rates, margins, and capital expenditures to suit your analysis.
- Financial Statements: Access to annual and quarterly reports for in-depth evaluation.
- Interactive Dashboard: Visualize essential valuation metrics and outcomes with ease.
Disclaimer
All information, articles, and product details provided on this website are for general informational and educational purposes only. We do not claim any ownership over, nor do we intend to infringe upon, any trademarks, copyrights, logos, brand names, or other intellectual property mentioned or depicted on this site. Such intellectual property remains the property of its respective owners, and any references here are made solely for identification or informational purposes, without implying any affiliation, endorsement, or partnership.
We make no representations or warranties, express or implied, regarding the accuracy, completeness, or suitability of any content or products presented. Nothing on this website should be construed as legal, tax, investment, financial, medical, or other professional advice. In addition, no part of this site—including articles or product references—constitutes a solicitation, recommendation, endorsement, advertisement, or offer to buy or sell any securities, franchises, or other financial instruments, particularly in jurisdictions where such activity would be unlawful.
All content is of a general nature and may not address the specific circumstances of any individual or entity. It is not a substitute for professional advice or services. Any actions you take based on the information provided here are strictly at your own risk. You accept full responsibility for any decisions or outcomes arising from your use of this website and agree to release us from any liability in connection with your use of, or reliance upon, the content or products found herein.